
The bitcoin price (BTC/USD) fell below $30,000 for the second time since January on Monday before extending declines on Tuesday. The pioneer cryptocurrency continues to trade within a bearish channel formation in the 60-min chart.
Bitcoin has now fallen several levels below the 100-hour moving average. The BTC/USD made a late rebound to recover from oversold conditions in the 14-hour RSI.
Bitcoin Price Fundamentals Overview

From a fundamental perspective, bitcoin is trading at a time of increased market uncertainty amid the rising cases of the delta variant of covid-19. Bitcoin plunged on Monday alongside global stocks as fears the delta variant could force countries back to lockdowns intensified.
Furthermore, bitcoin is also trading under pressure from increasing scrutiny. Earlier this month, China launched a crackdown on bitcoin mining companies resulting in a huge decline in crypto prices. And on Monday, “New Jersey Attorney General issued a Cease and Desist Order against the New Jersey-based crypto services firm BlockFi”, according to reports. Bitcoin price edged lower in the process dragging other cryptocurrencies.
From a positive view, bitcoin and the cryptocurrency market overall continue to attract more players with mainstream technology companies and financial services firms embracing crypto. Therefore, a rebound could still happen before the end of the year.
Bitcoin Price Technical Analysis (the 60-min Chart)
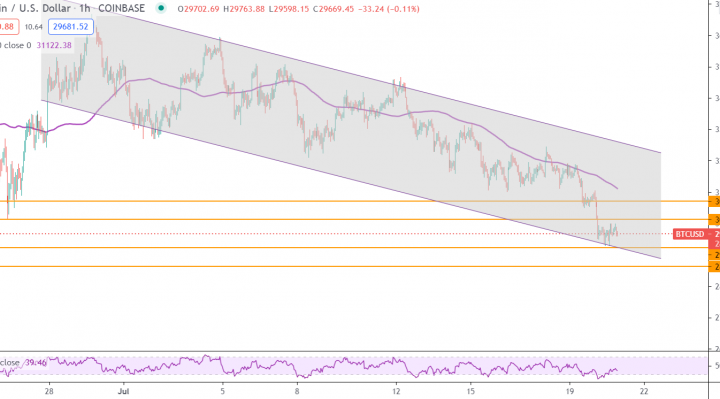
Technically, the BTC/USD appears to be trading within a descending channel formation in the 60-min chart. This indicates a significant short-term bearish bias in the market sentiment. However, bitcoin bounced back late on Tuesday to trim Monday’s losses.
The bulls will be looking to ride Tuesday’s late rebound by targeting profits at around $30,141 or higher at $30,714. On the other hand, the bears will look to extend the current declines towards $29,231 or lower to $28,631.
Bitcoin Price Technical Analysis (the Daily Chart)
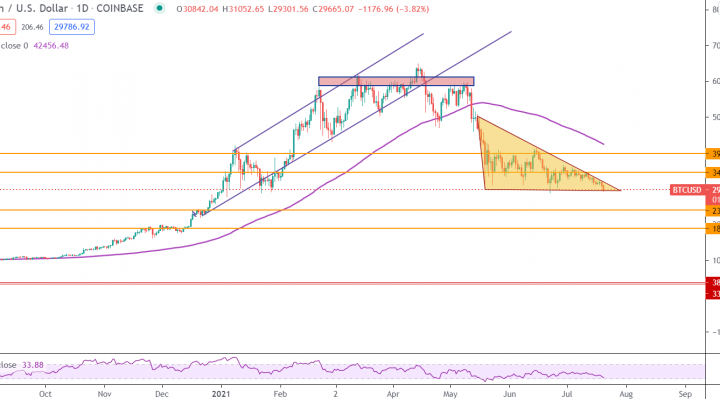
In the daily chart, the BTC/USD appears to be trading within a bearish triangle formation. The bitcoin price now looks to be about to make a bearish breakout after This week’s plunge. It has moved closer to oversold levels of the 14-day RSI.
The bears will be looking to ride the current bearish run by targeting profits at around $23,967 or lower at $18,855. On the other hand, the bulls will target potential rebounds at $34,475 or higher at $39,729.