
The bitcoin price on Thursday rallied to trade at about $26,896 before pulling back to settle at $26,651 following the latest round of US data. The BTC/USD continues to trade within an ascending channel formation in the 60-min chart.
The price of the pioneer cryptocurrency has now rallied to trade several levels above the 100-hour moving average line. However, Thursday’s late pullback prevented the BTC/USD from ascending to the overbought levels of the 14-hour RSI.
Bitcoin Price Fundamentals Overview

From a fundamental perspective, the BTC/USD is trading at the back of a relatively busy period in the market. On Thursday, the German investment bank Deutsche Bank, which is also one of the world’s largest asset managers with an AUM of over $1.34 trillion announced on Thursday that it will start offering Bitcoin and crypto custody services. This follows similar announcements by the UK’s Standard Chartered, US-based BNY Mellon and the Paris-based Societe Generale.
In the latest US economic data, US retail sales for August beat the expected (MoM) change of 0.2% with a change of 0.6%, while the retail sales ex-autos outshone the forecasted change of 0.4% with a change of 0.6%. On the other hand, the producer price index for August beat the forecasted (MoM) change of 0.2% with a change of 0.7%, while the (YoY) equivalent exceeded the forecast of 1.2% with a change of 1.6%. Elsewhere, the initial jobless claims for the week ending September 8 outperformed the expected claim count of 225k with a tally of 220k.
Bitcoin Price Technical Analysis (the 60-min Chart)

Technically, the price of bitcoin appears to be trading within an ascending channel formation in the 60-min chart. The hourly MACD also seems to support a bullish bias after completing an upward crossover.
Therefore, the bulls will be looking to extend the current rally towards $26,896 or higher to $27,157. On the other hand, the bears will look to pounce on pullbacks at about $26,411 or lower at $26,151.
Bitcoin Price Technical Analysis (the Daily Chart)
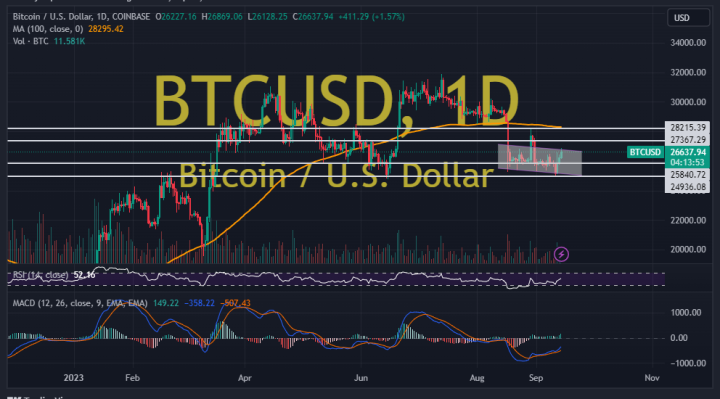
In the daily chart, the BTC/USD seems to be trading within a gently descending channel formation. The daily MACD also appears to be struggling for momentum as it continues to attempt an upward crossover.
Therefore, the bulls will be targeting long-term profits at about $27,367 or higher at $28,215. On the other hand, the bears will look to pounce on profits at about $25,840 or lower at $24,936.