
The bitcoin price on Friday pulled back to trade closer to $23,000 after setting a new multi-month high of about $23,700 On Thursday. The price of the pioneer cryptocurrency continues to trade within a gently ascending channel formation in the 60-min chart.
Friday’s pullback prevented the price of bitcoin from ascending into the overbought levels of the 14-hour RSI. As a result, it has since moved back towards the 100-hour moving average line.
Bitcoin Price Fundamentals Overview

From a fundamental perspective, bitcoin is trading at the back of a relatively busy period in the US market. The BTC/USD appears to be benefitting from the activity from the options market which keeps sending bullish signals. Moreover, the global markets seem to be returning to a more optimistic state following eight months of bear sentiment. This is pushing investors toward more risky assets that offer better returns and away from safe-haven currencies like the USD.
In the latest US data, the Michigan consumer sentiment index for January outperformed expectations. The durable goods data for December showed a change of 5.6% compared to an expectation of 2.5%, while the preliminary annualised gross domestic product for Q4 also beat the forecasted change of 2.6% with a change of 3.9%. Elsewhere, the initial jobless claims for the week ending January 20 outshone the expected claim count of 205k with a lower tally of 186k.
Bitcoin Price Technical Analysis (the 60-min Chart)
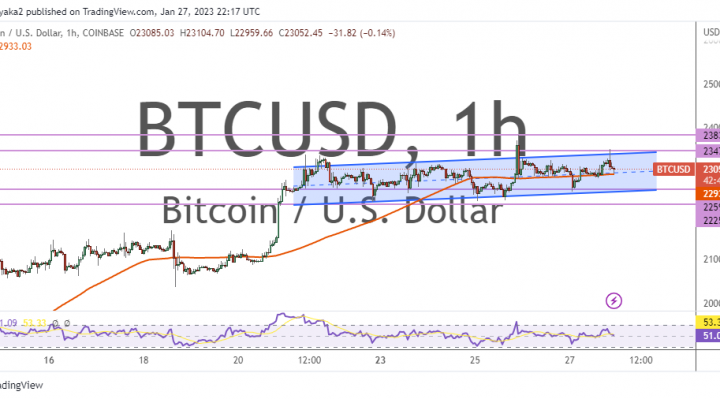
Technically, the bitcoin price appears to be trading within a gently ascending channel formation in the 60-min chart. This indicates a slight short-term bullish bias in the market sentiment.
Therefore, the bulls will be looking to extend the current run towards $23,472 or higher to $23,832. On the other hand, the bears will look to pounce on profits at about $22,591 or lower at $22,250.
Bitcoin Price Technical Analysis (the Daily Chart)
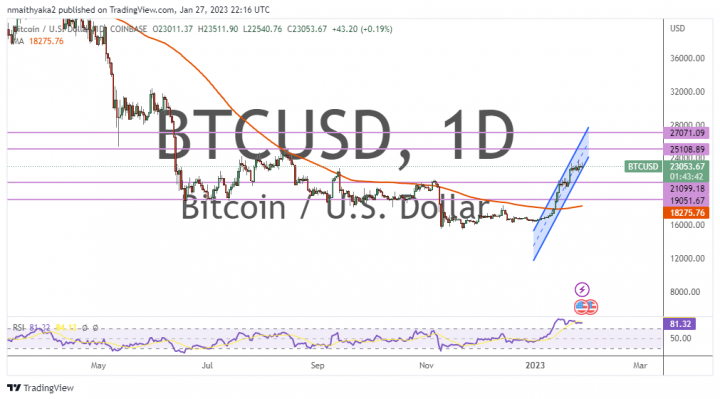
In the daily chart, the bitcoin price appears to be trading within a sharply ascending channel formation. This indicates a strong long-term bullish bias in the market sentiment.
Therefore, the bulls will be targeting long-term profits at about $25,108 or higher at $27,071. On the other hand, the bears will look to pounce on pullbacks at about $21,099 or lower at $19,051.