
The bitcoin price on Friday continued to trade in a sideways channel formation after recovering from Thursday’s pullback. The price of the pioneer cryptocurrency appears to have found strong support at about $16,800 level.
Bitcoin is now trading just above the 100-hour moving average line. It also continues to trade centrally in the 14-hour RSI, leaving room for a breakout in either direction.
Bitcoin Price Fundamentals Overview

From a fundamental perspective, bitcoin continues to struggle for momentum amid increased market risk. The industry has not recovered from the adverse effects of the FTX saga. Moreover, with the year coming to an end, investors are keeping their cards close and ready for the new year to reassess their options. Nonetheless, venture capital firms continue to invest in the industry, which is positive for the long-term outlook.
In addition, the BTC/USD is still under pressure from the strengthening of the greenback amid recent US economic data. On Friday, durable goods orders missed expectations on multiple verticals. However, the US GDP was impressive earlier in the week, coming in stronger than expected. The initial jobless claims for the week ending December 16, also beat expectations.
Bitcoin Price Technical Analysis (the 60-min Chart)
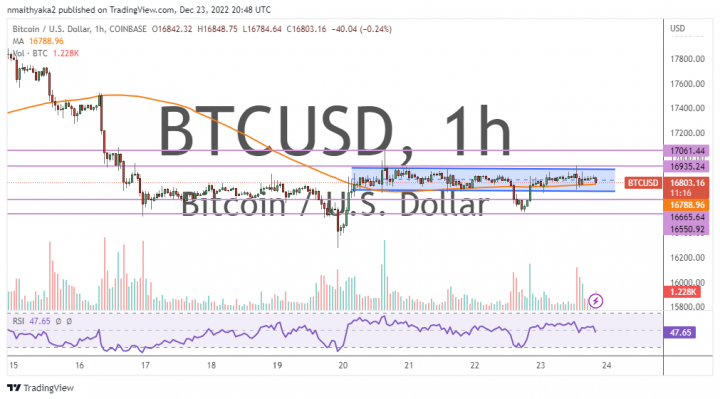
Technically, the bitcoin price appears to be oscillating within a sideways channel formation in the 60-min chart. This indicates a lack of clear directional bias in the short term.
Therefore, the bulls will be targeting potential upward breakout profits at about $16,935 or higher at $17,061. On the other hand, the bears will be targeting potential downward breakouts at about $16,665 or lower at $16,550.
Bitcoin Price Technical Analysis (the Daily Chart)
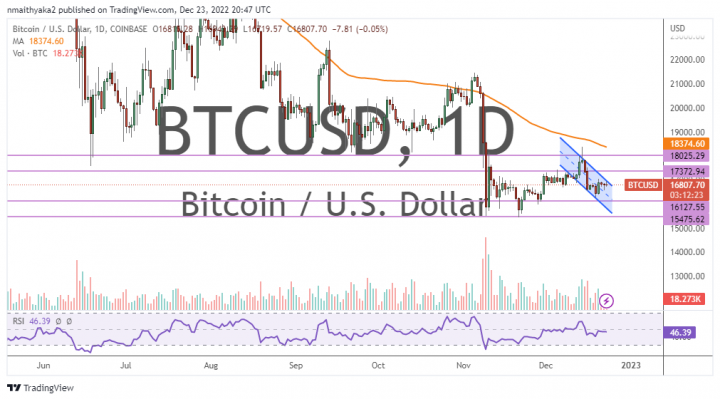
In the daily chart, the bitcoin price appears to be trading within a descending channel formation. This indicates a significant long-term bearish bias in the market sentiment.
Therefore, the bears will be looking to extend the current streak of declines toward $16,127 or lower to $15,475. On the other hand, the bulls will be targeting long-term profits at about $17,372 or higher at $18,025.