
Bitcoin prices closed above $17,000 for the first time since December 2017 this Tuesday.
The flagship cryptocurrency rallied in the early New York session, hitting $17,228 against a weakening US dollar. Nevertheless, its upside moves appeared more in the wake of rising institutional adoption, especially as mainstream investors hunt for anti-inflation assets against a negative-yielding bond market and a depreciating US dollar.

Today, it was Mariner Wealth Advisors, a wealth advisory firm with more than $35 billion assets under management, that hired Eaglebrook Bitcoin SMA to enable Bitcoin-enabled investment plans on their platform.
“We are excited to offer this new solution to clients of Mariner Wealth Advisors where bitcoin fits into their overall wealth plan,” said Marty Bicknell, CEO, and president of Mariner Wealth Advisors. “Our desire to find new solutions is always driven by client need and we are looking forward to working with Eaglebrook on this new endeavor.”
The announcement followed a similar adoption across corporations, asset management firms, and individual investors.
Just last week Friday, Skybridge Capital filed an amendment with the Securities and Exchange Commission, allowing their $3.6 billion funds to start investing in Bitcoin. Before that, billionaire investor Stan Druckenmiller admitted holding the cryptocurrency as a hedge against his inflation fears.
Overbought, Nevertheless
According to its Relative Strength Indicator, Bitcoin is trading at prices much higher than its actual cost. It is a barometer that measures the magnitude of recent price changes to evaluate an asset’s overbought or oversold conditions. It says Bitcoin is overbought.
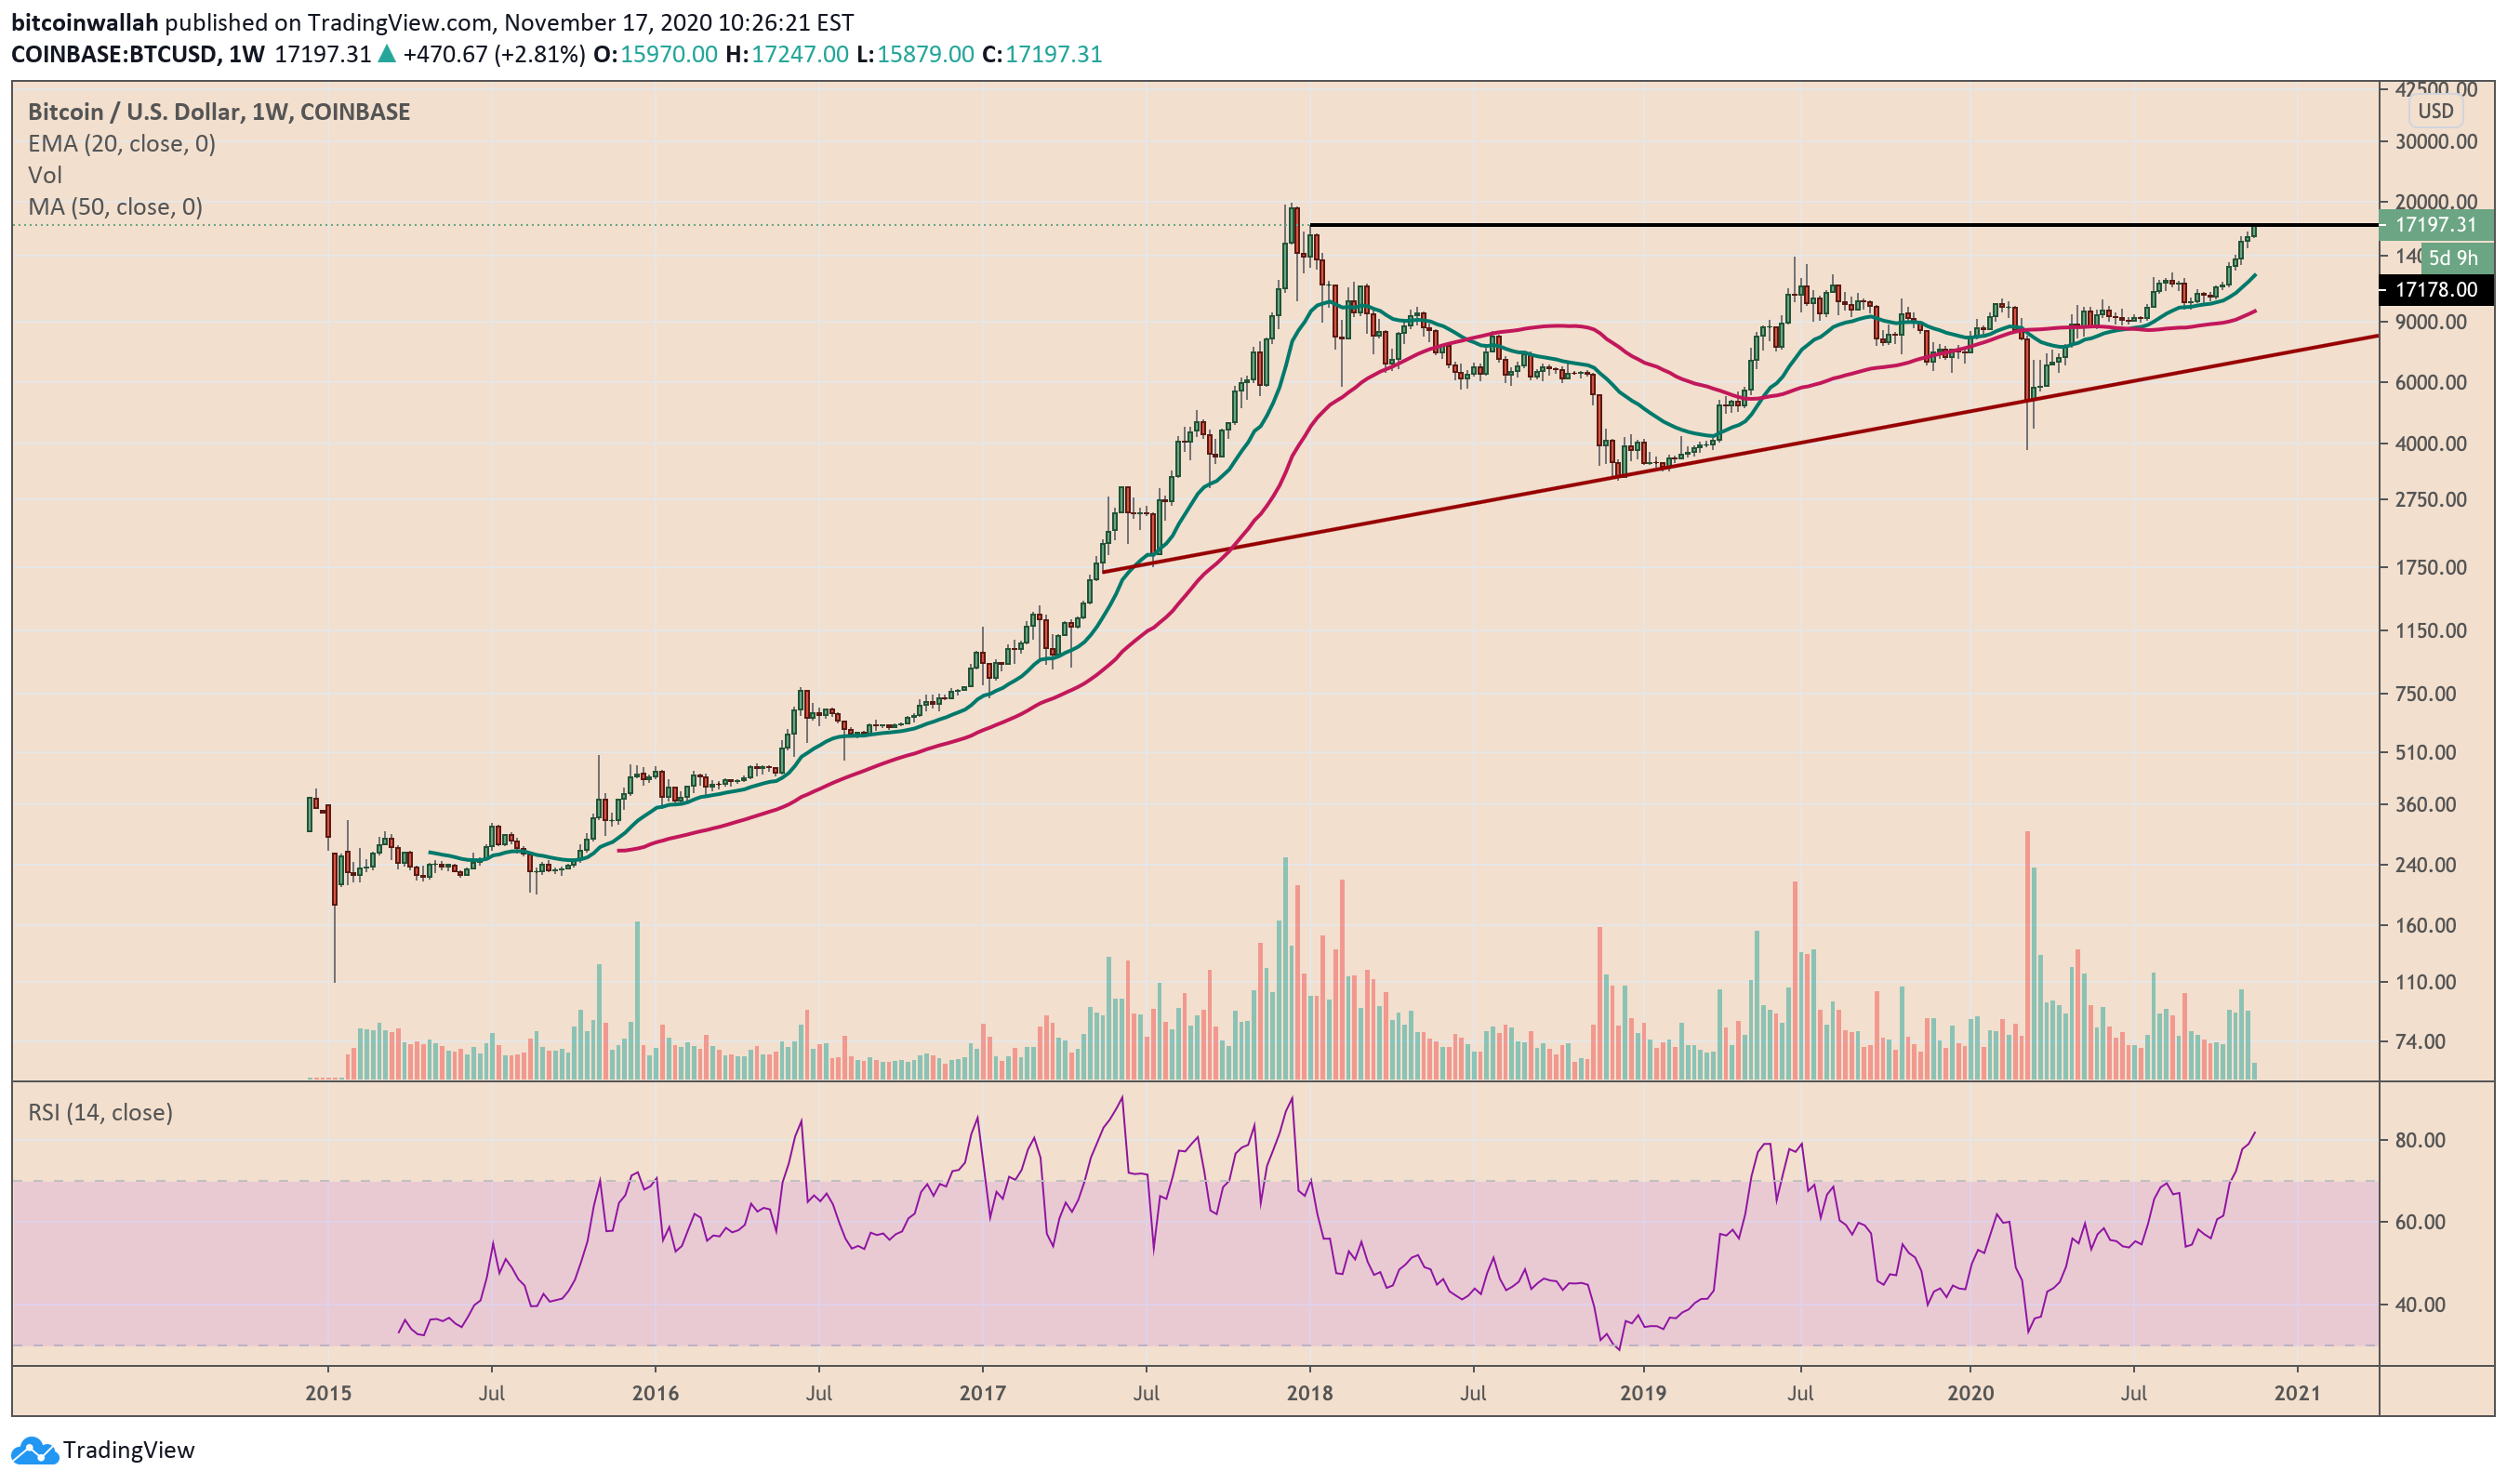
Bitcoin’s previous stints above an ’80’ RSI resulted in overextended bull runs. In 2017, as shown in the chart above, the price remained in an uptrend as long as the RSI returned an “overbought” signal. Nevertheless, it ultimately broke down due to profit-taking sentiment among investors.
Bitcoin Weekly Technical Setup
Back then, traders ignored the extended RSI readings due to the notorious ICO hype. People wanted to buy Bitcoin so they could use it to purchase security-like tokens of young blockchain startups. When those companies failed, they illegally dumped their BTC reserves en masse, leading to a price crash from $20,000 to as low as $3,000.
This time, the situation is different. Investors want to hold Bitcoin because of a confirmed inflationary outlook. As long as the fears persist, the demand for the cryptocurrency would go up.
Technically, a sell-off could have the Bitcoin price correct towards its 20-weekly exponential moving average (the green wave). If the curve holds as support, Bitcoin may continue its upside move towards higher price levels, beginning with a retest of its record high near $20,000.
Conversely, breaking the 20-WMA to the downside risks correcting BTC/USD to the 50-WMA below $10,000.