
Bitcoin enthusiasts are keeping a close eye on the market as the cryptocurrency graph seemingly forms a gigantic inverse head and shoulder on the weekly chart. While historically a bullish reversal could be anticipated here, analysts have warned that it could take numerous months before the formation sees a significant break. The pattern is still in formation and it may take 4 to 8 weeks to complete. For the duration of this consolidation, Bitcoin is projected to range between $56,000 and $76,000. Traders would like to see a weekly close above $76,000, which would validate the breakout and drive Bitcoin towards $100,000.

Bitcoin ($BTC) Market Anticipates Surge as Supply Scarcity Takes Center Stage

Despite the bullish expectations, BTC was trading at $63,944, remaining relatively consistent and sideways post halving. The reason behind it was that the market had already incorporated the halving into the price.
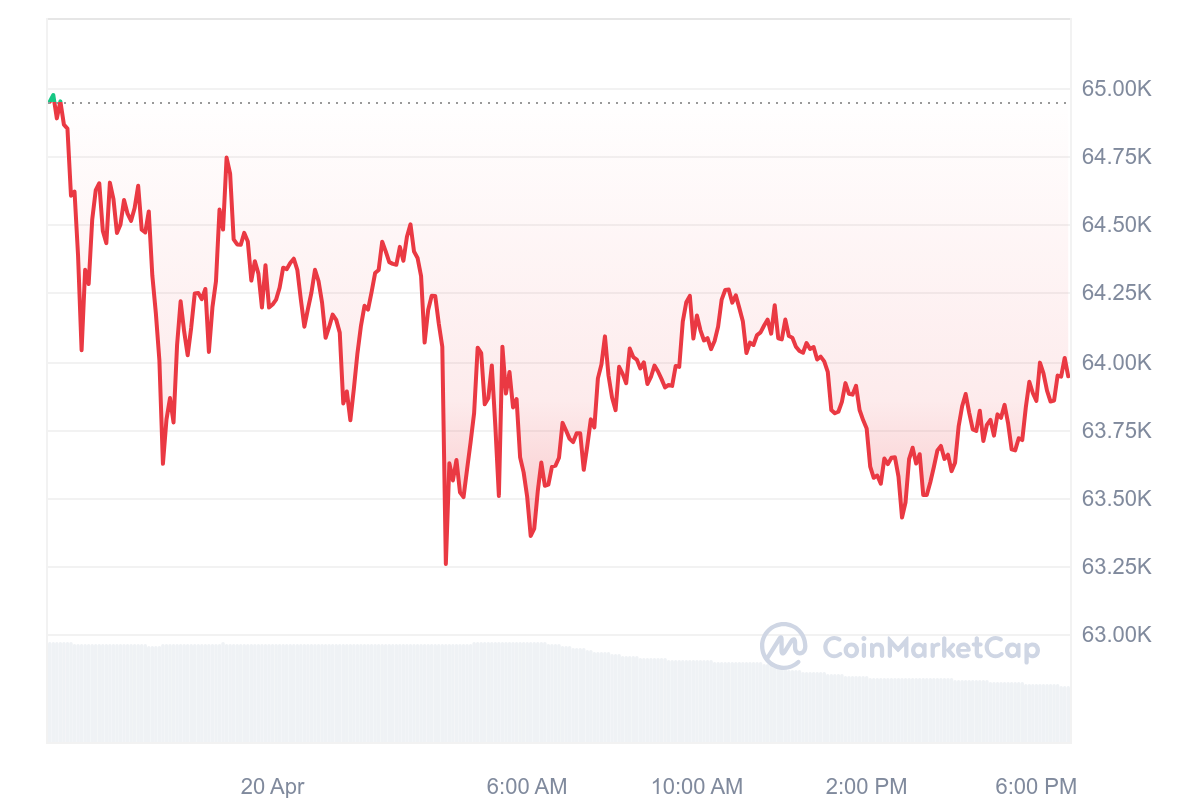
Although investors may have to wait for a long time before substantial profits, many are confident about Bitcoin’s future potential. Now that the supply has become even more scarce, some say a big price surge might not be far away, given the price behavior of the asset following the two preceding halving events.
As Bitcoin grows and develops as an asset class, buyers and sellers will watch its price patterns closely for indications of a major breakout and the next new phase of its journey.
BTC Halving Reduces Supply, With 450 BTC Daily Post-Event
Along with the technical analysis, Bitcoin has recently experienced a widely discussed event in the form of ‘halving’. The event, occurring every four years, halves the rewards received by miners, and thus leads to a 50% slower generation of new Bitcoin. The rationale behind halving is that BTC will be capped at 21 million coins in 2140. After the recent halving, 450 Bitcoin will only be generated daily, which means that newly formed supply will also fall.
Previous halvings, which took place in 2012, 2016, and 2020, were risky for Bitcoin, and its price often started to rally at least a year ahead of the event. Financial analysts, however, claim that history is rarely an indicator of future performance.