
The bitcoin price on Friday extended declines towards current 2-week lows of about $16,840 after the recent pullback. The price of the pioneer cryptocurrency has plummeted since hitting a new six-week high of $18,375 on Wednesday.
The BTC/USD still appears to be trading within a descending channel formation in the 60-min chart. As a result, the bitcoin price has now fallen to trade several levels below the 100-hour moving average line. It remains in the oversold conditions of the 14-hour RSI.
Bitcoin Price Fundamentals Overview

From a fundamental perspective, the bitcoin price still appears to be massively affected by the crypto winter. In addition, just as the industry is grappling with the adverse effects of the FTX saga, the mainstream players that would be deemed necessary for fidelity are beginning to pull out. On Friday, Mazars, one of the leading audit firms withdrew its audit services for crypto companies, which include Binance (the world’s biggest crypto exchange), Crypto.com and KuCoin among others. Reports indicate other notable auditors may be pulling out as well.
Mazars reportedly deleted an audit report it had published regarding Binance’s proof of liquidity. Several crypto exchange companies and marketplaces have claimed to have raised funds or set funds aside as reserves to cushion investors in the unlikely event that a situation that took FTX down happens again. However, with the withdrawal of major exchanges, it looks like exchanges may struggle to prove the reserves exist.
Bitcoin Price Technical Analysis (the 60-min Chart)
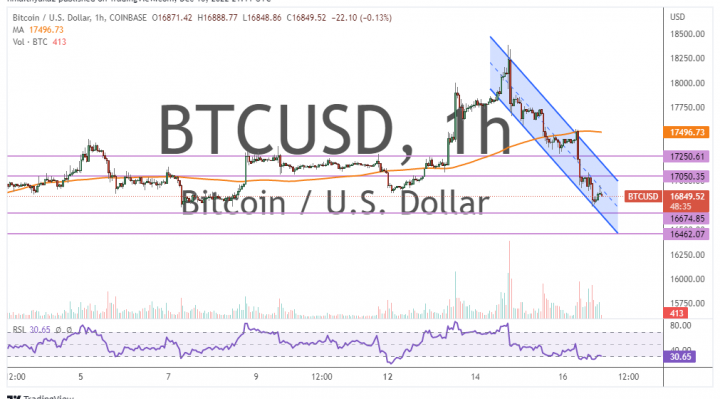
Technically, the price of the pioneer cryptocurrency appears to be trading within descending channel formation in the 60-min chart. This indicates a significant short-term bearish bias in the market sentiment.
Therefore, the bears will be looking to pounce on extended declines at about $16,674 or lower at $16,452. On the other hand, the bulls will be targeting short-term profits at about $17,050 or higher at $17,250.
Bitcoin Price Technical Analysis (the Daily Chart)
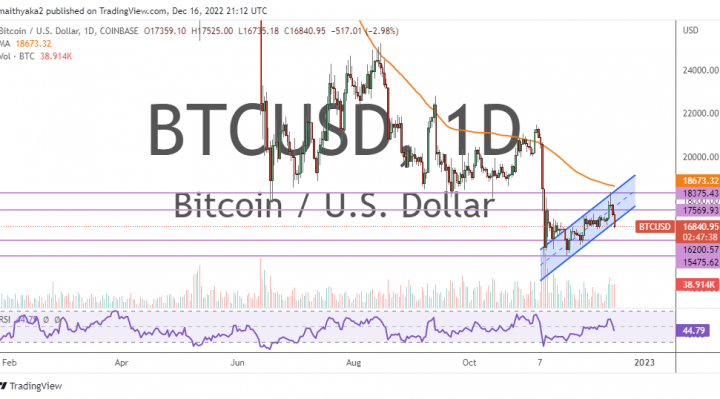
In the daily chart, the bitcoin price appears to be trading within an ascending channel formation. This indicates a significant long-term bullish bias in the market sentiment.
Therefore, the bulls will be looking to extend the current streak of gains toward $17,569 or higher to $0.18,375. On the other hand, the bears will be targeting long-term profits at about $16,200 or lower at $15,475.