
On Friday, the Bitcoin price bounced from the trendline support at about $99,743 to trade at about $101,607 after the latest U.S. data. The BTC/USD trades within a sideways channel formation in the 60-minute chart.
The price of the pioneer cryptocurrency has now advanced to trade a few levels above the 100-hour moving average line. As a result, Bitcoin moved closer to the overbought levels of the 14-hour RSI.
Bitcoin Price Fundamentals Overview

From a fundamental perspective, the BTC/USD trades during a relatively busy period in the U.S. market. The pioneer cryptocurrency continues to enjoy a bullish bias in the general market sentiment amid Trump’s pro-crypto-looking administration.
The U.S. President-Elect has already made key nominations for his administration, which align with his pre-election promises. He recently affirmed his stance that the government will look to add to its Bitcoin holdings, while various States have already made advances towards establishing a Bitcoin reserve.
In the latest U.S. economic data, the initial jobless claims for the week ending December 6 missed the expectation of 220k with a tally of 242k, up from the preceding month’s equivalent of 225k. The producer price index for November exceeded the forecasted (MoM) change of 0.2% with a change of 0.4%, while the (YoY) equivalent beat 2.6% with a change of 3%.
On the other hand, the producer price index ex-food and energy beat the estimate of 3.2% with a change of 3.4% (YoY). The (MoM) equivalent was in line with the forecast of 0.2%.
Bitcoin Price Technical Analysis (the 60-min Chart)
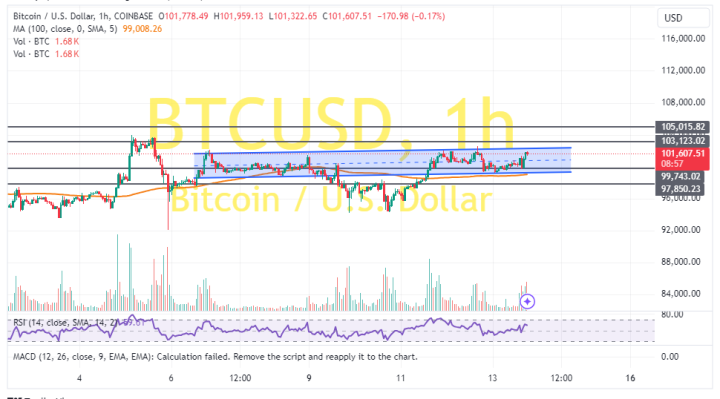
Technically, the BTC/USD trades within a sideways channel formation in the 60-minute chart. However, the 14-hour RSI has recently bounced black to move closer to the overbought conditions of the indicator.
Therefore, the bulls will look to stretch the current gains toward $103,123 or higher to $105,015. On the other hand, the bears will look to pounce on pullbacks at about $99,743 or lower at $97,850.
Bitcoin Price Technical Analysis (the 60-min Chart)
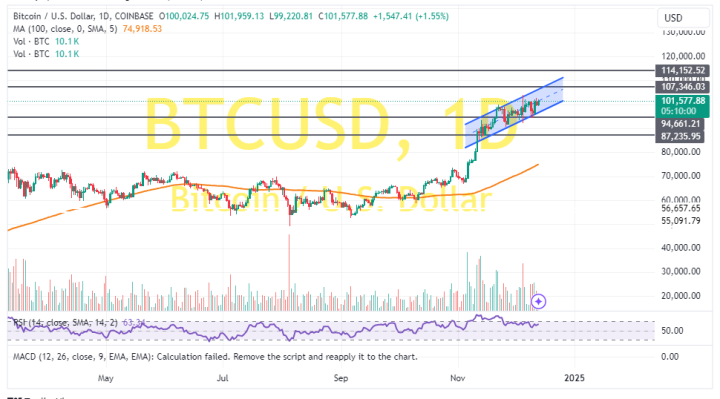
In the daily chart, the BTC/USD trades within an ascending channel formation. The 14-day RSI also seems to support a bullish bias as it moves closer to the overbought conditions.
Therefore, the bulls will look to ride the current run of gains toward $107,346 or higher to $114,152. On the other hand, the bears will look to pounce on profits at about $94,661 or lower at $87,235.