
On Friday, the Bitcoin price extended its sideways movement below $63,000 after Thursday’s pullback. The BTC/USD trades within a slightly descending channel formation in the 60-minute chart.
The price of the pioneer cryptocurrency has now fallen to trade a few levels below the 100-hour moving average line. However, it bounced back slightly to avoid falling into the oversold levels of the 14-hour RSI.
Bitcoin Price Fundamentals Overview

From a fundamental perspective, the BTC/USD trades during a relatively busy period in the US market. On Thursday, the initial jobless claims for last week came in worse than expected, with 226k versus a forecast of 225k, down from the previous week’s equivalent of 230k. The Philadelphia Fed Manufacturing Survey for June outperformed the expectation of 10, with a reading of 10.3, up from the previous month’s equivalent of -0.4.
On Wednesday, the Federal Reserve chose to keep the base interest rate unchanged at 3.75% as expected. Elsewhere, the retail sales for May exceeded the (MoM) forecast of 0.5%, with a change of 0.9%, while the retail sales ex-autos outshone the estimated change of 0.5%, with a change of 0.8% (MoM). On the other hand, the pending home sales for the month beat the expectation of 0.8%, with a change of 3.8% (MoM).
Earlier in the week, the US building permits for May missed the expectation of 1.42 million, with 1.413 million, down from 1.423 million in April. On the other hand, housing starts for the period fell short of 1.43 million, with 1.177 million, down from the previous month’s equivalent of 1.392 million.
Bitcoin Price Technical Analysis (the 60-min Chart)
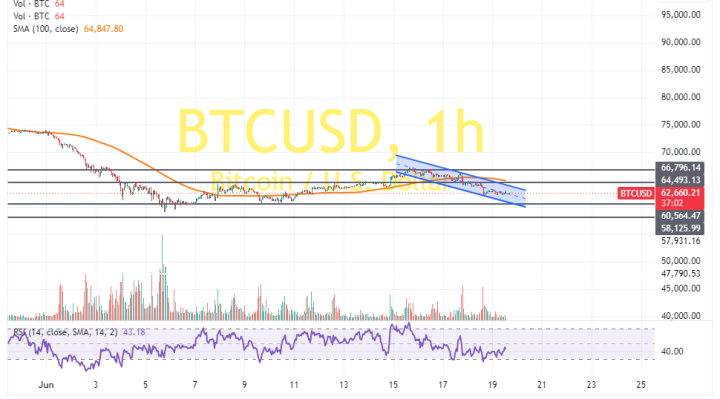
Technically, the Bitcoin price trades within a descending channel formation in the 60-minute chart. However, the 14-hour RSI has recently bounced back to avoid falling into oversold conditions.
Therefore, the bulls will look to extend the current rebound towards $64,493 or higher to $66,796. On the other hand, the bears will look to pounce on profits at about $60,564 or lower at $58,125.
Bitcoin Price Technical Analysis (the Daily Chart)
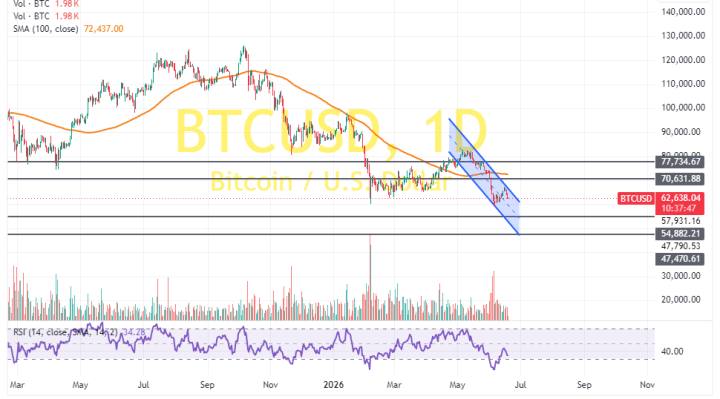
In the daily chart, the price of the pioneer cryptocurrency trades within a descending channel formation. However, the 14-day RSI has recently bounced back to recover from oversold conditions.
Therefore, the bulls will look to stretch the latest rebound towards $70,631 or higher to $77,734. On the other hand, the bears will look to pounce on profits at about $54,882 or lower at $47,470.