
On Friday, the Bitcoin price extended Thursday’s pullback to trade at about $95,416 after the latest U.S. economic data. The BTC/USD trades within a descending channel formation in the 60-minute chart.
The price of the pioneer cryptocurrency continues to trade above the 100-hour moving average line despite the pullback. As a result, it still has some room left to run before reaching oversold conditions.
Bitcoin Price Fundamentals Overview

From a fundamental perspective, the BTC/USD trades during a relatively busy period in the U.S. market. On Friday, the industrial production for December outperformed the (MoM) forecast of 0.1%, with a change of 0.4%.
On Thursday, the initial jobless claims for last week came lower than expected, with 198k versus a forecast of 215k, down from the preceding week’s claim count of 207k. The NY State Empire Manufacturing Index for January exceeded the expectation of 1, with a reading of 7.7. The Philadelphia Fed Manufacturing Survey for the month also came in better than expected, with 12.6 versus a forecast of -2.
Earlier in the week, the U.S. retail sales for November outperformed the expected (MoM) change of 0.4%, with a change of 0.6%. The retail sales ex-autos also beat the forecast of 0.4%, with a change of 0.5% (MoM).
On the other hand, the producer price index for the month matched the expected (MoM) change of 0.2%. The (YoY) equivalent exceeded the forecasted change of 2.7%, with a change of 3%. The producer price index ex-food and energy fell short of the (MoM) forecast of 0.3%, with 0%, but beat the (YoY) equivalent of 2.7%, with 3%.
Bitcoin Price Technical Analysis (the 60-min Chart)
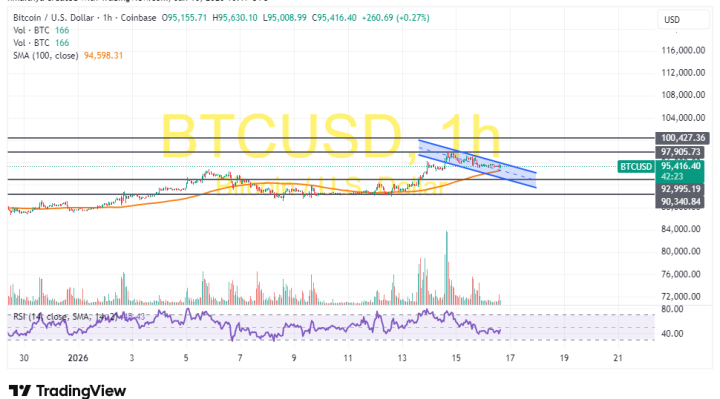
Technically, the Bitcoin price trades within a descending channel formation in the 60-minute chart. However, the 14-hour RSI still has some room left to run before reaching oversold conditions.
Therefore, the bears will look to extend the current pullback towards $92,995 or lower to $90,340. On the other hand, the bulls will look to pounce on profits at about $97,905 or higher at $100,427.
Bitcoin Price Technical Analysis (the Daily Chart)
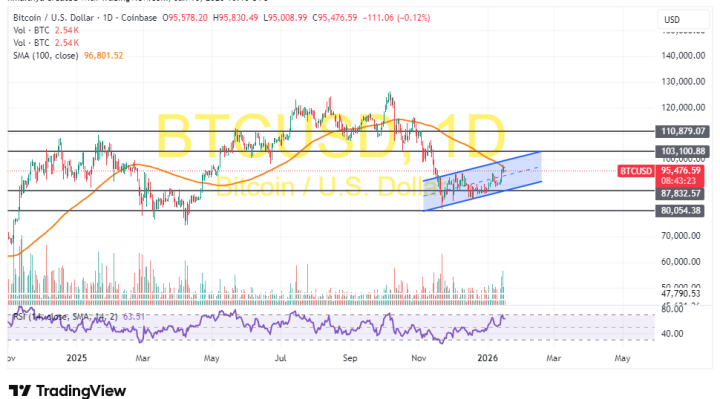
In the daily chart, the price of the pioneer cryptocurrency trades within an ascending channel formation. The 14-day RSI also supports a long-term bullish bias as it edges closer to overbought conditions.
Therefore, the bulls will look to ride the current rally towards $103,100 or higher to $110,879. On the other hand, the bears will look to pounce on pullbacks at about $87,832 or lower at $80,054.