
On Friday, the bitcoin price pulled back from the session highs of about $95,053 to trade at about $93,284. The BTC/USD also completed a downward breakout from an ascending channel formation in the 60-minute chart.
Bitcoin has now fallen to trade a few levels below the 100-hour moving average line. As a result, the price of the pioneer cryptocurrency is moved closer to the oversold levels of the 14-hour RSI.
Bitcoin Price Fundamentals Overview

From a fundamental perspective, BTC/USD trades during a relatively busy period in the U.S. market. On Friday, the US jobs data for December exceeded expectations of 160k with a taly of 256k, up from the previous month’s equivalent of 212k.
On the other hand, the average hourly wage growth for the month missed the expected (YoY) change of 4% with a change of 3.9%, down from the preceding month’s equivalent of 4%, while the (MoM) equivalent was in line with the estimate of 0.3%, down from 0.4%. The unemployment rate for the month edged slightly lower to 4.1% down from 4.2% in November, beating the forecasted rate of 4.2%.
Elsewhere, the preliminary Michigan Consumer Sentiment Index for January fell to 73.2, down from 74 in December, missing the forecasted reading of 73.8. The preliminary UoM 5-year inflation expectation for the month increased to 3.3%, up from 3%.
Earlier in the week, the U.S. initial jobless claims for the week ending January 3 fell to 201k, down from 211k in the preceding week, beating the forecasted claim count of 218k, while the ADP employment change for December missed 140k with a tally of 122k, down from 146k in November.
Bitcoin Price Technal Analysis (the 60-min Chart)
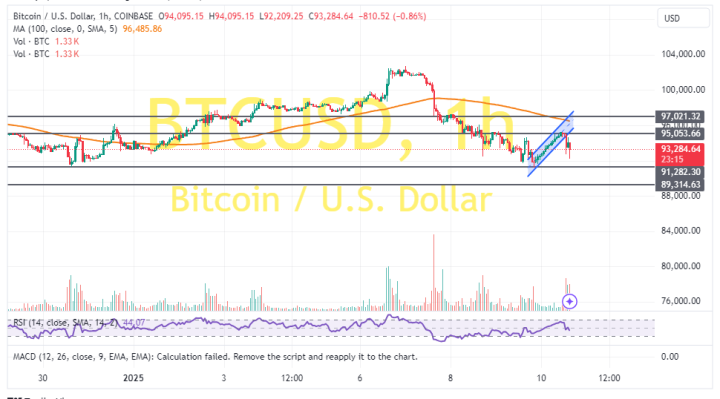
Technically, the BTC/USD has completed a downward breakout from an ascending channel formation in the 60-min chart. The 14-hour RSI has also pulled back to avoid rallying into overbought conditions.
Therefore, the bears will look to extend the current pullback towards $91,282 or lower to $89,314. On the other hand, the bulls will look to pounce on rebounds at about $95,053 or higher at $97,021.
Bitcoin Price Technical Analysis (the Daily Chart)
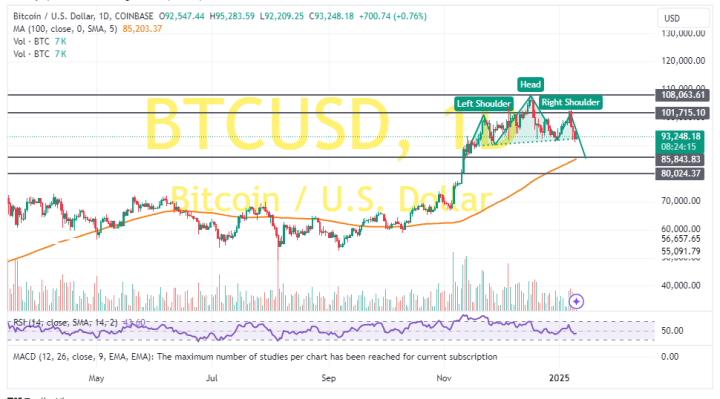
In the daily chart, the BTC/USD is about to complete a head-and-shoulders pattern formation. The 14-day RSI has also pulled back to avoid rallying into the overbought conditions.
Therefore, the bears will be targeting long-term pullbacks at about $85,843 or lower at $80,024. On the other hand, the bulls will look to pounce on profits at about $101,715 or higher at $108,063