
On Friday, the Bitcoin price pulled back off the session highs of about $64,071 to trade at about $63,249 after the latest data. The BTC/USD continues to trade within an ascending channel formation in the 60-minute chart.
The pioneer cryptocurrency has now ascended to trade a few levels above the 100-hour moving average line. Friday’s pullback prevented Bitcoin from returning to the overbought levels of the 14-hour RSI.
Bitcoin Price Fundamentals Overview

From a fundamental perspective, the BTC/USD trades during a relatively busy period in the US market. On Thursday, US existing home sales change for August came in at -2.5% compared to a change of 1.5% in the previous period.
On the other hand, the Philadelphia Fed manufacturing Survey for September outshone the forecasted reading of -1 with a reading of 1.7, up from the preceding month’s equivalent of -7. The US initial jobless claims for the week ending September 13 also impressed with a significantly lower claim count of 219k versus a forecast of 230, down from 231k in the preceding week.
Earlier in the week, the Federal Reserve cut the base interest rate by 50 basis points to 5%, down from 5.5%. Analysts were expecting a rate cut of 25 basis points to 5.25%. The interest rate projection for the next 1 year is also down to 3.4% from 4.1%, while the 2-year projection is down to 2.9% from 3.1%.
The 3-year projection remains unchanged at 2.9%, while the long-term rate is now 2.9%, up from 2.8%. Elsewhere, building permits for August came in better than expected with 1.475 million versus a forecast of 1.41 million, while housing starts stood at 1.356 million, versus an estimate of 1.31 million.
Bitcoin Price Technical Analysis (the 60-min Chart)
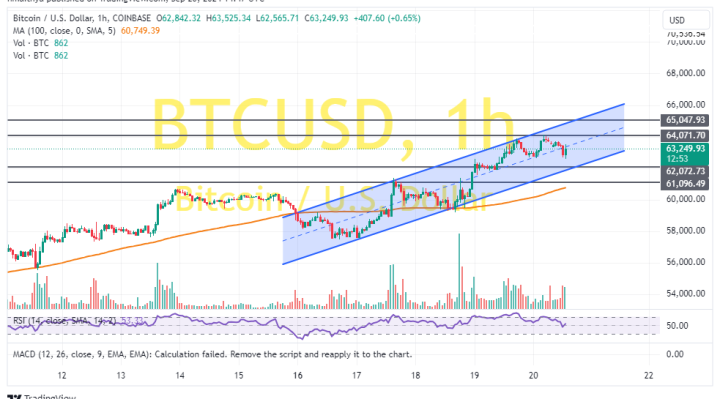
Technically, the BTC/USD trades within an ascending channel formation in the 60-minute chart. However, the 14-hour RSI has recently pulled back to avoid rallying into overbought conditions.
Therefore, the bears will target extended pullbacks at about $62,072 or lower at $61.096. On the other hand, the bulls will look to pounce on short-term rebounds at about $64,071 or higher at $65,047.
Bitcoin Price Technical Analysis (the 60-min Chart)
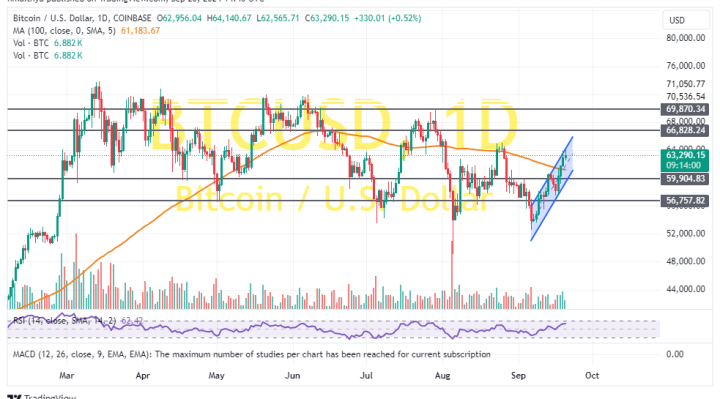
In the daily chart, Bitcoin trades within an ascending channel formation rallying to new monthly highs. The 14-day RSI has also ascended to move closer to the overbought conditions.
Therefore, the bulls will look to stretch the current rally towards $66,878 or higher to $69,870. On the other hand, the bears will look to pounce on pullbacks at about $59,904 or lower at $56,757.