
On Friday, the Bitcoin price pulled back off the session highs of about $71,624 to trade at about $69,247 after U.S. nonfarm payrolls. The BTC/USD remains outside the descending channel formation, which it earlier broke out from.
The price of the pioneer cryptocurrency has fallen a few levels below the 100-hour moving average line. Friday’s late pullback prevented Bitcoin from advancing into the overbought levels of the 14-hour RSI.
Bitcoin Price Fundamentals Overview

From a fundamental perspective, the BTC/USD trades during a relatively busy period in the U.S. market. On Friday, the U.S. jobs data for October fell to 12k, down from 223k in the preceding month, missing the forecasted tally of 113k.
On the other hand, the average hourly wage for the period outshone the forecasted (MoM) growth of 0.3% with 0.4%. The (YoY) equivalent was in line with the estimate of 4%. The unemployment rate for the period also matched the forecast of 4.1%, unchanged from September.
Elsewhere, the ISM manufacturing PMI for October missed the expected reading of 47.6 with a reading of 46.5, while the ISM Manufacturing Prices Paid beat the estimate of 48.5 with 54.8.
On Thursday, the U.S. initial jobless claims for the week ending October 25 edged lower to 216k, down from 228k in the preceding week, beating the forecast of 230k. The Chicago Purchasing Managers’ Index for the month fell short of 47 with a reading of 41.6, while personal spending outshone the expectation of 0.4% with a change of 0.5%.
Bitcoin Price Technical Analysis (the 60-min Chart)
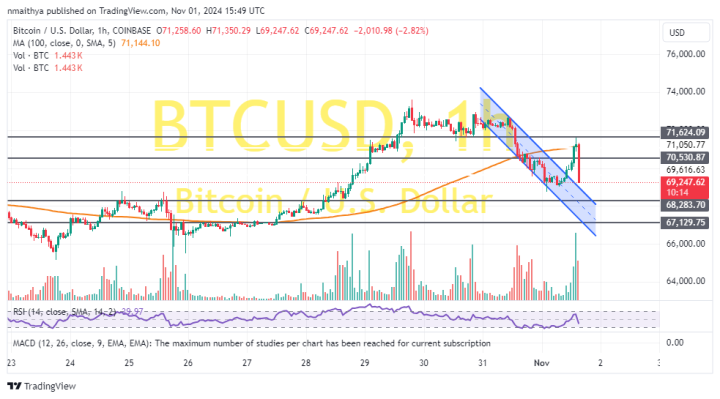
Technically, the Bitcoin price is on the verge of re-entering the descending channel formation following Friday’s late rebound. The 14-hour RSI also supports a bearish bias as it moves closer to oversold conditions.
Therefore, the bears will look to extend the current pullback towards $68,283 or lower to $67,129. On the other hand, the bulls will look to pounce on rebounds at about $70,530 or higher at $71,624.
Bitcoin Price Technical Analysis (the Daily Chart)
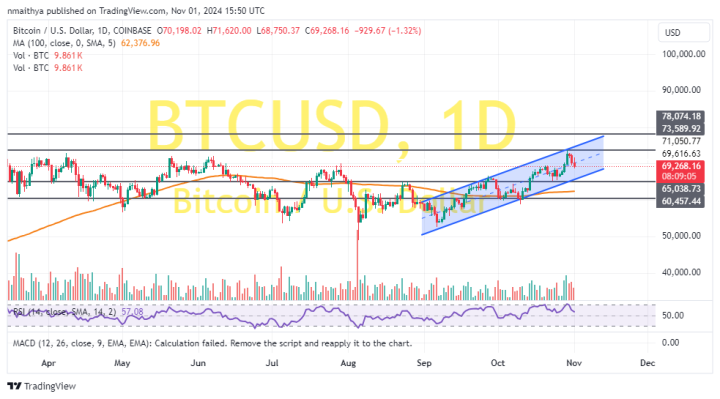
In the daily chart, the pioneer cryptocurrency trades within an ascending channel formation. However, the 14-hour RSI has pulled back to avoid rallying into the overbought conditions of the indicator.
Therefore, the bears will look to extend long-term pullbacks toward $65,008 or lower to $60,457. On the other hand, the bulls will look to ride the current rally towards $73,589 or higher to $78,074.