
On Friday, the Bitcoin price rallied to trade at the current week’s high of about $98,804 before pulling back to $97,354. The BTC/USD trades within an ascending channel formation in the 60-minute chart.
Bitcoin has now ascended to trade a few levels above the 100-hour moving average line. However, Friday’s late pullback prevented the price of the pioneer cryptocurrency from rallying into the overbought levels of the 14-hour RSI.
Bitcoin Price Fundamentals Overview

From a fundamental perspective, the BTC/USD trades during a relatively busy period in the market. Earlier in the week, news emerged that Michael Saylor’s Microstrategy now holds 386,700 BTC after acquiring an additional 55,500 for $5.4 billion.
Later in the week, it was reported that Marathon Digital acquired an additional 703 Bitcoin, bringing the total Bitcoin it purchased during November to 6,474 BTC. Meanwhile, more stakeholders in the crypto industry continue to express optimism about a crypto-friendly legal framework in the U.S. following Trump’s re-election.
In the latest U.S. economic data, the preliminary annualised U.S. gross domestic product for Q3 matched the expectation of 2.8%, the same as the previous quarter. The preliminary gross domestic product price index for the period beat the forecast of 1.8% with a change of 1.9%, up from 1.8% from the preceding quarter.
On the other hand, the personal spending for October outshone the estimated change of 0.3% with a change of 0.4%, while the personal income beat 0.3% with a (MoM) change of 0.6%.
Bitcoin Price Technical Analysis (the 60-min Chart)
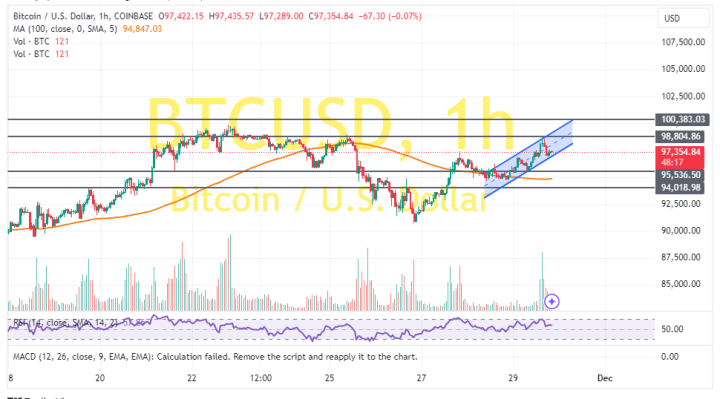
Technically, the BTC/USD trades within an ascending channel formation in the 60-minute chart. However, the 14-hour RSI has recently pulled back to avoid rallying into the overbought conditions.
Therefore, the bears will look to extend the pullbacks toward $95,536 or lower to $94,018. On the other hand, the bulls will look to extend the current rally towards $98,804 or higher to $100,383.
Bitcoin Price Technical Analysis (the Daily Chart)
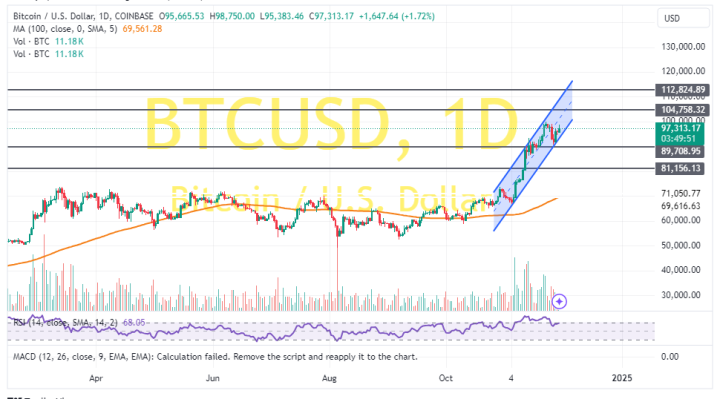
In the daily chart, the Bitcoin price trades within an ascending channel formation. However, the 14-day RSI has pulled back to recover from the oversold conditions of the indicator.
Therefore, the bears will be targeting extended pullbacks at about $89,708 or lower at $81,156. On the other hand, the bulls will look to ride the current rally towards $104,758 or higher to $112,824.