
The bitcoin price on Thursday pulled back off session highs of about $37,500 to trade at about $35,854 after the latest round of data. The BTC/USD appears to be trading within a sharply descending channel formation in the 60-min chart.
The price of bitcoin has now fallen to trade below the 100-hour moving average line. As a result, the pioneer cryptocurrency appears to be on the verge of entering the oversold levels of the 14-hour RSI.
Bitcoin Price Fundamentals Overview

From a fundamental perspective, the BTC/USD is trading at the back of a relatively busy period in the market. On Wednesday, Canadian business mogul and Shark Tank co-host claimed it could be another 18 months before any Spot Bitcoin ETF is approved by the SEC. On Thursday, BlackRock, one of the global investment companies seeking approval for their Spot Bitcoin ETF, filed an application for Spot Ethereum ETF. The Spot crypto ETF buzz continues despite the SEC’s reluctance to approve the first applications.
In the latest round of US data, the initial jobless claims for the week ending November 10 missed the expected claim count of 220k with a higher tally of 231k. The Philadelphia Fed Manufacturing Survey for November outperformed the expectation of -9 with a reading of -5.9 up from the previous update of -9.
On Wednesday, US retail sales for October beat the expected (MoM) change of -0.3% with a change of -0.1%. Retail sales ex-autos for the period also outshone the estimate of 0% with a change of 0.1%. The producer price index ex-food and energy missed 2.7% (YoY) and 0.3% (MoM), with changes of 2.4% and 0%, respectively.
Bitcoin Price Technical Analysis (the 60-min Chart)
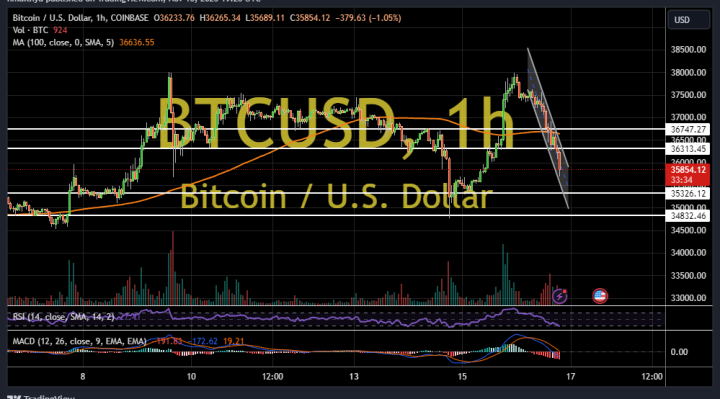
Technically, the price of bitcoin appears to be trading within a sharply descending channel formation in the 60-min chart. The hourly MACD also seems to support a bearish bias after completing a downward crossover.
Therefore, the bears will be looking to extend the current pullback towards $35,326 or lower to $34,832. On the other hand, the bulls will look to pounce on rebounds at about $36,313 or higher at $36,747.
Bitcoin Price Technical Analysis (the Daily Chart)
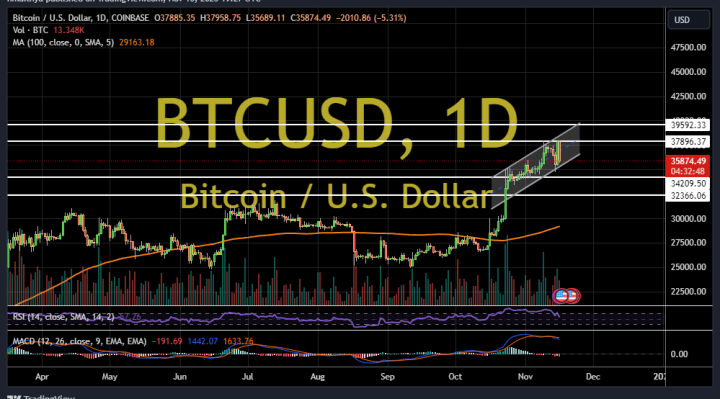
In the daily chart, the price of the pioneer cryptocurrency appears to be trading within an ascending channel formation. However, the daily MACD seems to be running out of momentum as it attempts a downward crossover.
Therefore, the bears will be targeting long-term profits at about $34,209 or lower at $32,366. On the other hand, the bulls will be looking to pounce on profits at about $37,896 or higher at $39,592.