
The bitcoin price on Friday pulled back off session highs of about $43,059 to trade at about $41,950 after the latest round of data. The BTC/USD continues to trade within a gently descending channel formation in the 60-minute chart.
Bitcoin has now plummeted to trade a few levels below the 100-hour moving average line. As a result, the price of the pioneer cryptocurrency appears to be moving closer to the oversold levels of the 14-hour RSI.
Bitcoin Price Fundamentals Overview

From a fundamental perspective, the BTC/USD is trading at the back of a relatively busy period in the US market. On Friday, the Chicago purchasing manager’s index for December missed the expected reading of 51 with a reading of 46.9. On Thursday, the initial jobless claims for the week ending December 22 missed the expected claim count of 210k with a higher tally of 218k. Pending home sales for November also fell short of the forecasted change of 1% with a change of 0%.
Earlier in the week, the Richmond Fed Manufacturing Index for December failed to match the expectation of -7 with a reading of -11. The housing price index for October also fell short of the estimated change of 0.5% with a (MoM) change of 0.3%, while the S&P/Case-Shiller Home Price Indices for the month missed the expected (YoY) change of 5% with a change of 4.9%. Traders will be looking forward to potential Spot Bitcoin ETF approvals in early 2024.
Bitcoin Price Technical Analysis (the 60-min Chart)
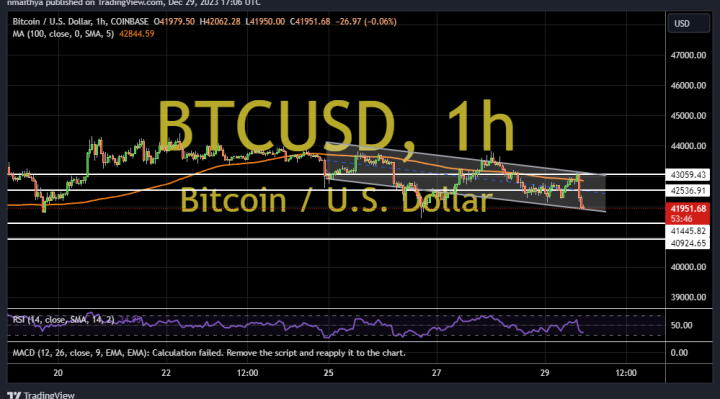
Technically, the bitcoin price appears to be trading within a gently descending channel formation in the 60-minute chart. The 14-hour RSI also appears to support a short-term bearish bias as it moves closer to oversold conditions.
Therefore, the bears will be looking to extend the current run of declines toward $41,445 or lower to $40,924. On the other hand, the bulls will be targeting potential rebounds at about $42,536 or higher at $43,059.
Bitcoin Price Technical Analysis (the Daily Chart)
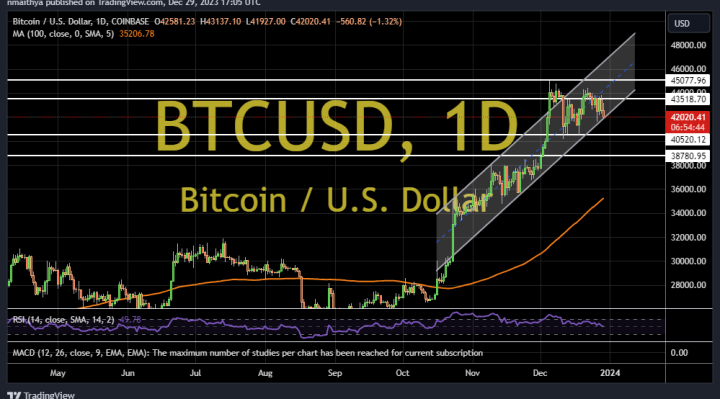
In the daily chart, the price of the pioneer cryptocurrency appears to be trading within an ascending channel formation. However, the 14-day RSI has recently pulled back to avoid rallying into overbought conditions.
Therefore, the bears will be targeting extended pullbacks at about $40,520 or lower at $38,780. On the other hand, the Bulls will look to pounce on rebounds at about $43,518 or higher at $45,077.