
On Friday, the Bitcoin price extended Thursday’s pullback from the current week’s high of about $78,022 to trade at $76,709. The BTC/USD trades within a sideways channel formation in the 60-minute chart.
The price of the pioneer cryptocurrency has now fallen to trade slightly below the 100-hour moving average line. As a result, it is on the verge of entering the oversold levels of the 14-hour RSI.
Bitcoin Price Fundamentals Overview

From a fundamental perspective, the BTC/USD trades during a relatively busy period in the US market. On Friday, the Michigan Consumer Expectations Index for May missed the forecasted reading of 48.5, with a reading of 44.1. The Michigan Consumer Sentiment Inde for the period also fell short of 48.2, with a reading of 44.8.
On the other hand, the UoM 1-year consumer inflation expectation for May outperformed the forecasted rate of 4.5%, with a rate of 4.8%, up from 4.5% in April. The UoM 5-year consumer inflation expectation for the period also beat the estimated rate of 3.4%, with a rate of 3.9%, up from the preceding month’s equivalent of 3.4%.
Earlier in the week, US building permits for April beat the expectation of 1.39 million, with a tally of 1.442 million. The housing starts for the period also exceeded the forecast of 1.41 million, with a tally of 1.465 million.
Elsewhere, the initial jobless claims for last week came in better than expected, at 209k versus a forecast of 210k, down from the previous week’s equivalent of 212k. On the other hand, the Philadelphia Fed Manufacturing Survey for May fell short of the forecasted reading of 18, with a reading of -0.4, down from 26.7 in April.
Bitcoin Price Technical Analysis (the 60-min Chart)
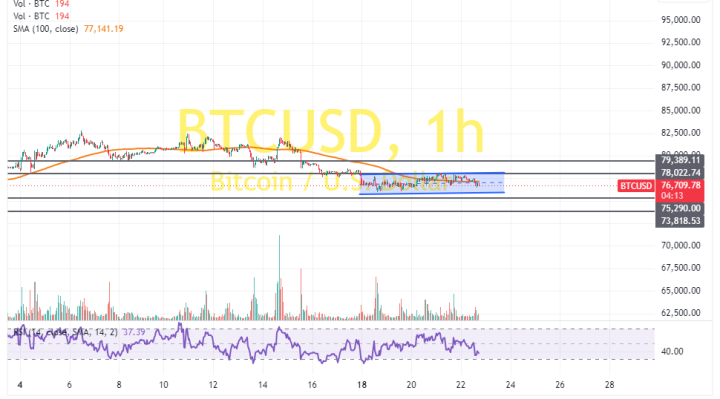
Technically, the Bitcoin price trades within a sideways channel formation in the 60-minute chart. However, the 14-hour RSI has recently pulled back to avoid rallying into overbought conditions.
Therefore, the bears will look to stretch the latest pullback towards $75,790 or lower to $73,818. On the other hand, the bulls will look to pounce on profits at about $78,022 or higher at $79,389.
Bitcoin Price Technical Analysis (the Daily Chart)
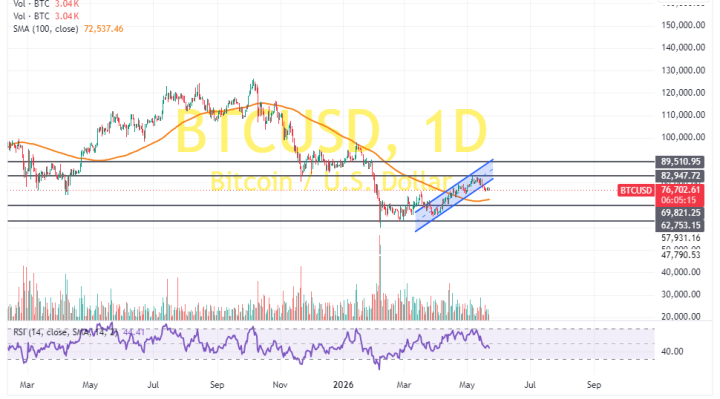
In the daily chart, the price of the pioneer cryptocurrency has recently completed a downward breakout from an ascending channel formation. The 14-day RSI also supports a bearish bias after pulling back to avoid entering into overbought conditions.
Therefore, the bears will look to extend the current pullback towards $69,821 or lower to $62,753. On the other hand, the bulls will look to pounce on rebounds at about $82,947 or higher at $89,510.