
The bitcoin price on Friday extended declines after pulling back on Thursday. The price of the pioneer cryptocurrency is trading within a descending channel formation in the 60-min chart.
As a result, bitcoin has now plummeted to trade below the 100-hour moving average line. This has pushed the BTC/USD closer to the oversold levels of the 14-hour RSI.
Bitcoin Price Fundamentals Overview

The bitcoin price continues to experience pressure amid the crypto winter. Moreover, recent US economic data is showing signs of a steady recovery with the ADP employment change for December outperforming forecasts. The initial jobless claims for the week ending December 30 also outshone the forecasted claim count of 225k with a tally of 204k, while continuing claims for the preceding week beat 1.708 million with a tally of 1.694 million.
On Friday, the US nonfarm payrolls for December outperformed the expected job count of 200k with a tally of 223k. The unemployment rate also edged lower to 3.5% from 3.6% in November compared to a forecast of 3.7%, while average hourly earnings for the month grew by 4.6% missing the market estimate of 5%.
From a crypto industry perspective, a bitcoin whale recently moved $250 million of BTC for reasons unknown while more whales continued to enter the fray according to Binance trade activity.
Bitcoin Price Technical Analysis (the 60-min Chart)
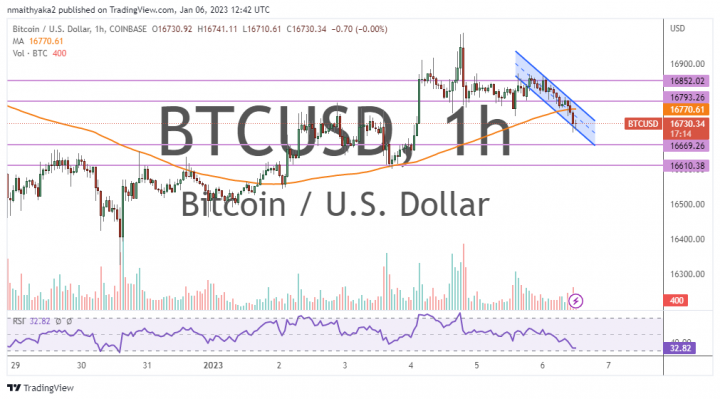
Technically, the bitcoin price appears to be trading within a descending channel formation in the 60-min chart. This indicates a significant short-term bearish bias in the market sentiment.
Therefore, the bears will be looking to stretch the current declines toward $16,669 or lower to $16,610. On the other hand, the bulls will look to pounce on profits at about $16,793 or higher at $16,852.
Bitcoin Price Technical Analysis (the Daily Chart)
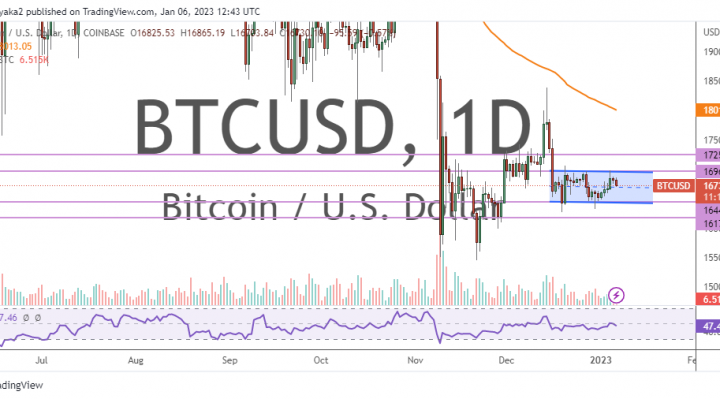
In the daily chart, the BTC/USD appears to be trading within a sideways channel formation. This indicates a lack of a clear directional bias in the market sentiment.
Therefore, the bulls will be targeting potential channel breakout profits at about $16,969 or higher at $17,251. On the other hand, the bears will look to pounce on profits at about $16,446 or lower at $16,178.