
The bitcoin price on Friday continued to trade within a consolidative triangle formation pushing the price below $28,000. The price of the pioneer cryptocurrency continues to trade below the 100-hour moving average line
As a result, the BTC/USD seems to be pinned centrally in the 14-hour RSI. This sets the Bitcoin price up for a potential breakout.
Bitcoin Price Fundamentals Overview

From a fundamental perspective, the bitcoin price is trading at the back of a relatively busy period in the US market. On Friday, the US non-farm payrolls for March missed the expected job count of 240k with a slightly lower tally of 236k.
On the other hand, the unemployment rate edged lower to 3.5% down from 3.6% in February, beating the expected rate of 3.6%, while the average hourly wage for the period missed the (YoY) forecast of 5.4% with a change of 5.2%. Elsewhere, the labour force participation rate for March outshone the estimated rate of 62.4% with a rate of 62.6%, up from February’s equivalent of 62.5%.
Earlier in the week, both the ISM Manufacturing and ISM Services PMIs fell short of estimates. The S&P Global PMIs also failed to match expectations. The initial jobless claims missed the expected claim count of 200k with a slightly higher tally of 228k, while the ADP Employment change also missed the expected job count of 200k with a tally of 145k.
Bitcoin Price Technical Analysis (the 60-min Chart)
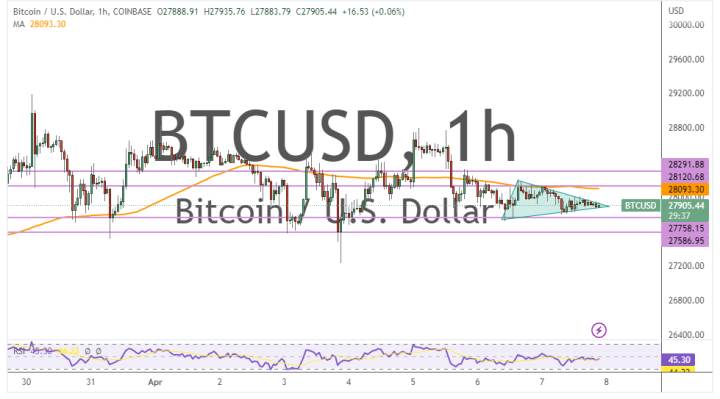
Technically, the bitcoin price appears to be trading within a consolidative triangle formation in the 60-min chart. This indicates a lack of a clear directional bias in the market sentiment.
Therefore, the bulls will be targeting potential upward breakouts at about $28,120 or higher at $28,291. On the other hand, the bears will be targeting potential downward breakouts at about $27,758 or lower at $27,586.
Bitcoin Price Technical Analysis (the Daily Chart)
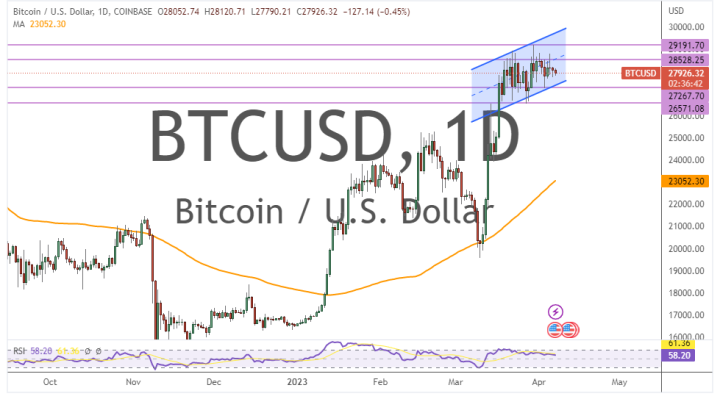
In the daily chart, the price of bitcoin appears to be trading within an ascending channel formation. This indicates a significant long-term bullish bias in the market sentiment.
Therefore, the bulls will be looking to ride the current wave of gains toward $28,528 or higher at $29,191. On the other hand, the bears will be targeting long-term profits at about $27,267 or lower at $26,571.