
Bitcoin price on Friday pulled back off the current 12-month highs of about $31,273 to trade at about $$29,329 before bouncing back to $$30,358. The BTC/USD appears to be trading within a sideways channel formation in the 60-min chart.
The price of the pioneer cryptocurrency appears to be pinned next to the 100-hour moving average line after the late rebound. The rebound also prevented the BTC/USD from falling into the oversold levels of the 14-hour RSI.
Bitcoin Price Fundamentals Overview

From a fundamental perspective, the pioneer cryptocurrency is trading at the back of a relatively busy period in the market. Recently several US banks and investment management institutions have filed applications to offer spot bitcoin ETFs. This sparked the recent surge in the price of BTC/USD. However, on Friday, the SEC ruled stated that those applications were not clear and comprehensive after failing to approve the applications. However, this leaves a window of opportunity for the applicants to add more information to their applications.
In the latest round of US data, the personal consumption expenditures price index for May missed the expected (MoM) change of 0.5% with a change of 0.1%. The (YoY) equivalent also fell short of the forecasted change of 4.6% with a change of 3.8%. On the other hand, the core personal consumption expenditures price index for the period missed both the (MoM) and (YoY) expectations of 0.4% and 4.7%, respectively with a change of 0.3% and 4.6%.
Bitcoin Price Technical Analysis (the 60-min Chart)
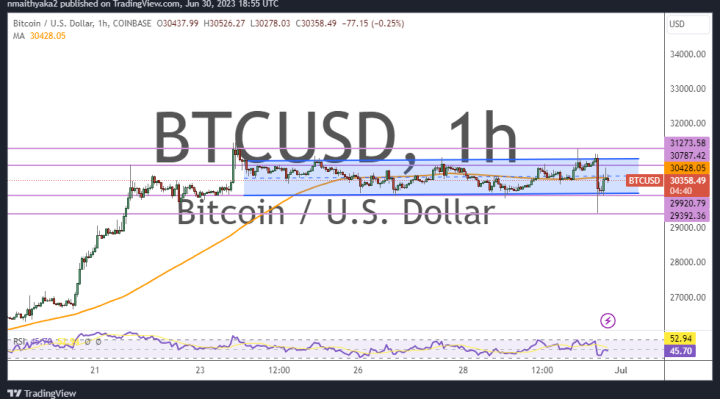
Technically, the bitcoin price appears to be trading within a sideways channel formation in the 60-min chart. This indicates a lack of a clear short-term directional bias in the market sentiment.
Therefore, the bears will be targeting potential downward breakouts at about $29,920 or lower at $29,392. On the other hand, the bulls will look to pounce on profits at about $30,787 or higher at $31,273.
Bitcoin Price Technical Analysis (the Daily Chart)
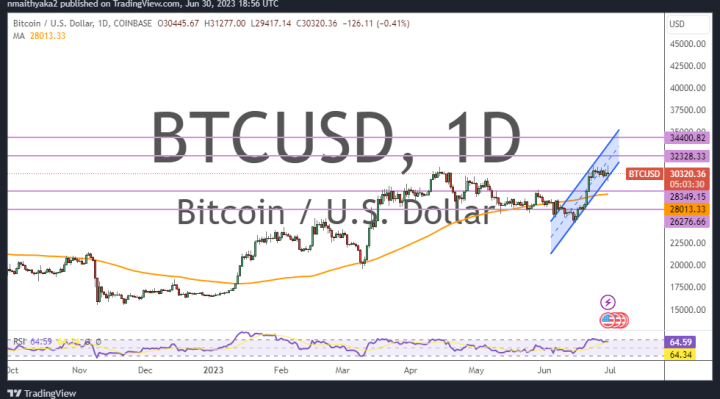
In the daily chart, the price of the pioneer cryptocurrency appears to be trading within an ascending channel formation. This indicates a significant long-term bullish bias in the market sentiment.
Therefore, the bulls will be looking to ride the current wave of gains towards $32,328 or higher to $34,400. On the other hand, the bears will be targeting profits at about $28,349 or lower at $26,276.