
The bitcoin price on Thursday raced to a new 13-month high of about $31,874, before pulling back to trade at $31,233 on Friday. The BTC/USD appears to be trading within a descending channel formation in the 60-min chart.
Bitcoin still remains a few levels above the 100-hour moving average line despite the pullback. As a result the price of the pioneer cryptocurrency still seems to have more room left to run before reaching the oversold levels of the 14-hour RSI.
Bitcoin Price Fundamentals Overview

From a fundamental perspective, the pioneer cryptocurrency is trading at the back of a relatively busy period in the market. The BTC/USD appears to be benefitting from a burgeoning positivity around cryptocurrencies following Ripple’s (XRP) win against the SEC. Moreover, bitcoin is boosted by recent statements from traditional finance experts, who see it as a possible future global currency, potentially replacing fiat currencies. BlackRock’s CEO has emerged as one of the leading proponents of Bitcoin after his company applied for a Bitcoin Spot ETF.
In the latest round of US data, the preliminary Michigan Consumer Sentiment Index for July beat the expected reading of 65.5 with a reading of 72.6. On the other hand, the preliminary UoM 5-year consumer inflation expectation for July matched the forecasted rate of 3.1%, up from 3% in the previous update. On Thursday, the US producer price index ex-food and energy missed the estimated change of 2.6% with a change of 2.4%.
Bitcoin Price Technical Analysis (the 60-min Chart)
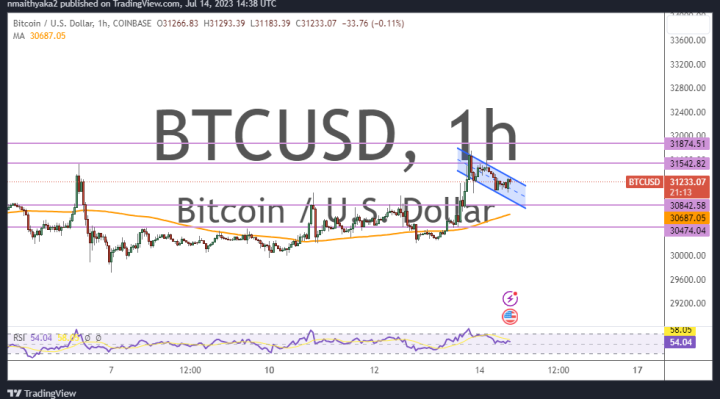
Technically, the Bitcoin price appears to be trading within a descending channel formation in the 60-min chart. This indicates a significant short-term bearish bias in the market sentiment.
Therefore, the bulls will be targeting potential rebound profits at about 432,542 or higher at $31,874. On the other hand, the bears will look to stretch the current pullback towards $30,842 or lower to $30,474.
Bitcoin Price Technical Analysis (the Daily Chart)
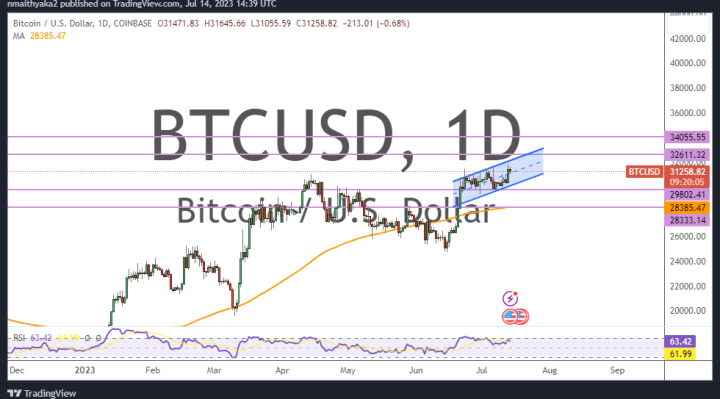
In the daily chart, the price of the pioneer cryptocurrency appears to be trading within an ascending channel formation. This indicates a significant long-term bullish bias in the market sentiment.
Therefore, the bulls will be looking to extend the current run of gains toward $32,611 or higher to $34,055. On the other hand, the bears will be targeting long-term profits at about $29,802 or lower at $28,333.