
The bitcoin price on Tuesday spiked to trade at a new 9-month high of about $26,556 before pulling back later to $24,296. The BTC/USD appears to have regained some of the lost ground on Friday morning advancing to trade at about $24,881.
The price of the pioneer cryptocurrency now seems to be trading within a gently ascending channel formation after trimming Tuesday’s spike. As a result, the BTC/USD is now back within the normal trading zone of the 14-hour RSI.
Bitcoin Price Fundamentals Overview

From a fundamental perspective, bitcoin is trading at the back of a relatively busy period in the market. The price of the pioneer cryptocurrency appears to be benefitting from the banking industry contagion that has seen top US banks collapse in the latest financial industry meltdown. Although industry experts have tried to link the fall of Silicon Valley Bank and Signature Bank to crypto, the BTC seems to suggest otherwise given its recent resurgence despite a strengthening US dollar.
In the latest US economic data, the consumer price index matched both the (MoM) and (YoY) expectations of 0.4% and 6%, respectively, down from January’s equivalents of 0.5% and 6.4%. On Wednesday, US retail sales for February missed the (MoM) expectation of -0.3% with a change of -0.4%, while the retail sales control group for the period outshone the forecasted change of -1.2% with a change of 0.5%. Elsewhere, the retail sales ex-autos matched the estimated change of -0.1% (MoM).
Bitcoin Price Technical Analysis (the 60-min Chart)
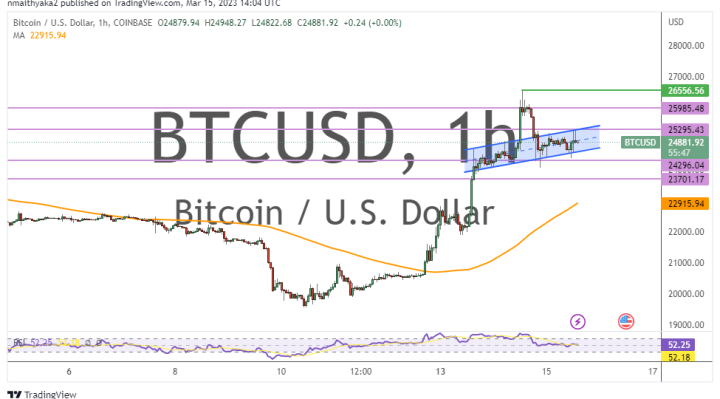
Technically, the price of bitcoin appears to be trading within a gently ascending channel formation in the 60-min chart. This indicates a slight short-term bullish bias in the market sentiment.
Therefore, the bulls will be looking to ride the current wave of gains toward $25,295, or higher to $25,985. On the other hand, the bears will look to pounce on pullbacks at about $24,296 or lower at $23,701.
Bitcoin Price Technical Analysis (the Daily Chart)
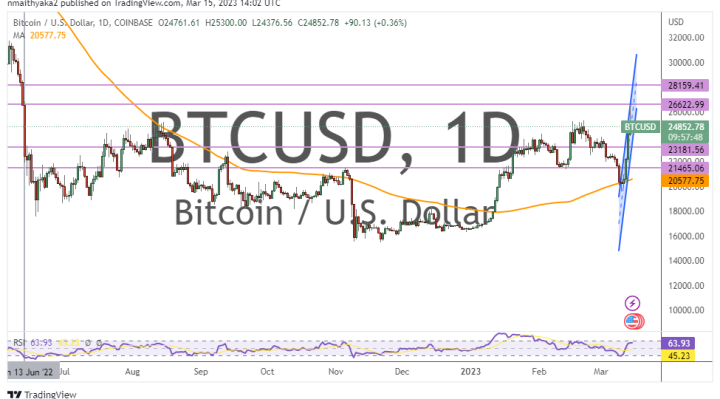
In the daily chart, the price of the pioneer cryptocurrency appears to be oscillating within a sharply ascending channel formation. This indicates a strong long-term bullish bias in the market sentiment.
Therefore, the bulls will be looking to extend the current rally toward $26,622 or higher to $28,159. On the other hand, the bears will be targeting long-term profits at about $23,181 or lower at $21,465.