
The bitcoin price on Friday pulled back off the current 52-week high of about $52,365 to trade at about $51,380. The BTC/USD continues to trade within a gently ascending channel formation in the 60-minute chart.
Despite Friday’s pullback, the price of the pioneer cryptocurrency continues to trade above the 100-hour moving average line. However, the pullback prevented the bitcoin price from advancing into the overbought levels of the 14-hour RSI.
Bitcoin Price Fundamentals Overview

From a fundamental perspective, the BTC/USD is trading at the back of a relatively busy period in the US market. On Thursday, the US retail sales for January missed the expected (MoM) change of -0.1% with a change of -0.8%.
The retail sales ex-autos for the period also fell short of 0.2% with a change of -0.6% (MoM). On the other hand, the initial jobless claims for the week ending February 9, outshone the forecasted claim count of 220k with a tally of 212k. The continuing claims for the preceding week missed the forecast of 1.88 million with 1.895 million.
Elsewhere, the NY Empire State Manufacturing Index for February outperformed the expectation of -15 with a reading of 2.4, while the Philadelphia Fed Manufacturing Survey for the period beat -8 with 5.2. The import price index for January exceeded the expected (MoM) change of 0% with a change of 0.8%.
The export price index for the period also beat the estimate of -0.1% with a change of 0.8%, while the industrial production for January missed the estimated (MoM) change of 0.3% with a change of -0.1%.
Bitcoin Price Technical Analysis (the 60-min Chart)
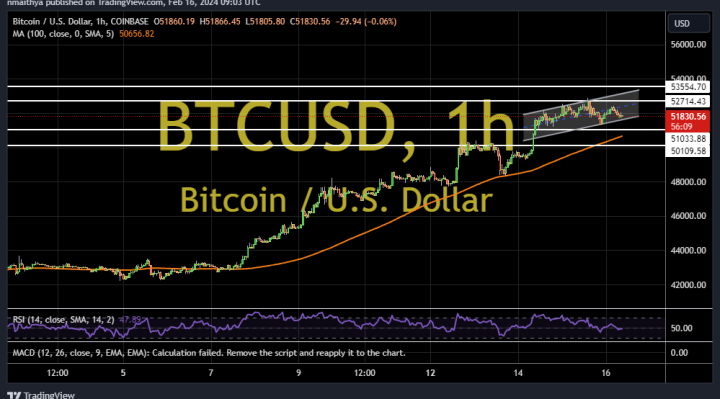
Technically, the bitcoin price appears to be trading within a gently ascending channel formation in the 60-minute chart. However, the 14-hour RSI has recently pulled back to avoid rallying into overbought conditions.
Therefore, the bears will be targeting extended pullbacks at about $51,033 or lower at $50,109. On the other hand, the bulls will look to extend the current rally towards $52,714 or higher to $53,554.
Bitcoin Price Technical Analysis (the Daily Chart)
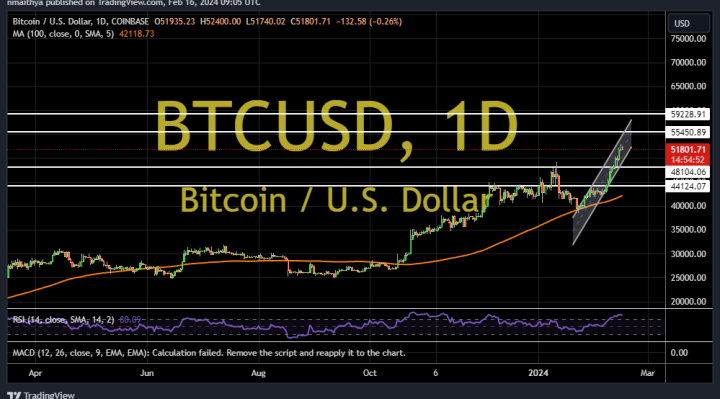
In the daily chart, the price of the pioneer cryptocurrency appears to be trading within a sharply ascending channel formation. The 14-day RSI also seems to support a long-term bullish bias after entering overbought conditions.
Therefore, the bulls will be looking to ride the current wave of gains toward $55,450 or higher to $59,228. On the other hand, the bears will be targeting potential pullbacks at about $48,104 or lower at $44,124.