
The bitcoin price on Thursday pulled back off the current monthly highs of about $27,316 to trade at about $26,936. The BTC/USD appears close to completing a downward breakout from an ascending channel formation.
The price of the pioneer cryptocurrency has now rallied to trade several levels above the 100-hour moving average line. Thursday’s late pullback pushed the BTC/USD back to the normal trading zone of the 14-hour RSI.
Bitcoin Price Fundamentals Overview

From a fundamental perspective, the pioneer cryptocurrency is trading at the back of a relatively busy period in the US market. On Thursday, the core personal consumption expenditures for Q2 matched the (QoQ) forecast of 3.7%. Personal consumption expenditure prices for the period also came in line with the estimated change of 2.5%.
The US gross domestic product price index for Q2 missed the expectation of 2% with a change of 1.7%, while the annualised gross domestic product for the period matched the estimate of 2.1%. The initial jobless claims for last week outperformed the expected claim count of 215k with a lower tally of 204k while pending home sales missed the estimated change of -0.8% with a change of -7.1% (MoM).
The BTC continues to experience a boost from the growing crypto interest in the mainstream financial services industry, with stories emerging on Thursday that BlackRock is planning to apply for an Ethereum Spot ETF. The US-based global asset management giant has already submitted to the Securities Exchange Commission its application for a Bitcoin Spot ETF.
Bitcoin Price Technical Analysis (the 60-min Chart)

Technically, BTC/USD appears to be about to complete a downward breakout from an ascending channel formation. However, the hourly MACD continues to support a bullish case after completing an upward crossover.
Therefore, the bulls will be targeting short-term rebound profits at about $27,123 or higher at $27,316. On the other hand, the bears will look to pounce on extended pullbacks at about $26,721 or lower at $26,526.
Bitcoin Price Technical Analysis (the Daily Chart)
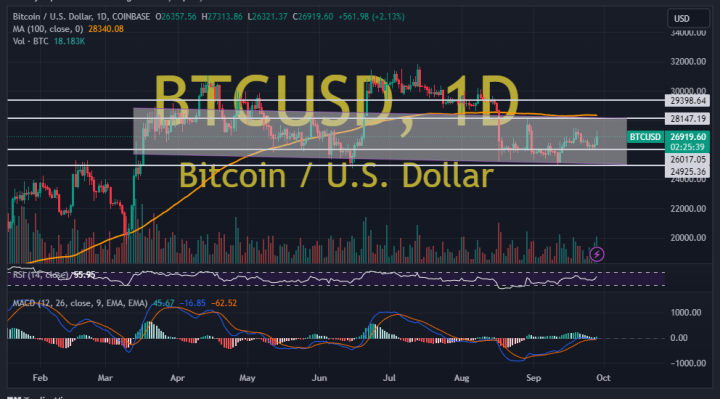
In the daily chart, the price of the pioneer cryptocurrency appears to be trading within a sideways channel formation. The daily MACD appears to be slightly in favour of the bulls after completing an upward crossover in late August.
Therefore, the bulls will be targeting long-term profits at about $28,147 or higher at $29,398. On the other hand, the bears will look to pounce on pullbacks at about $26,017 or lower at $24,925.