
On Friday, the Bitcoin price pulled back from the session highs ogf about $106,108 to trade at about $104,556 after the latest U.S. data. The BTC/USD trades within an ascending channel formation in the 60-minute chart.
Despite the pullback, the price of the original cryptocurrency continues to oscillate above the 100-hour moving average line. Bitcoin remains centrally pinned in the 14-hour RSI.
Bitcoin Price Fundamentals Overview

From a fundamental perspective, the BTC/USD trades during a relatively busy period in the U.S. market. On Friday, the Chicago Purchasing Managers’ Index for January missed the expectation of 40 with a reading of 39.5. On the other hand, personal spending for December outperformed the forecast of 0.5% with a change of 0.7%, while the personal income for the period was in line with the estimated change of 0.4%.
Elsewhere, the personal consumption expenditures – price index for December was in line with the forecasted (MoM) and (YoY) rates of 0.3% and 2.6%, respectively. The core personal consumption expenditures – price index for the period also matched the estimates of 0.2% and 2.8%.
Earlier in the week, the Federal Reserve chose to keep the base interest rate unchanged at 4.5% in line with expectations. The preliminary annualised U.S. gross domestic product for Q4 missed the expected change of 2.6% with a change of 2.3%. The preliminary U.S. gross domestic product – -price index for the quarter also fell short of 2.5% with a change of 2.2%.
Bitcoin Price Technical Analysis (the 60-min Chart)
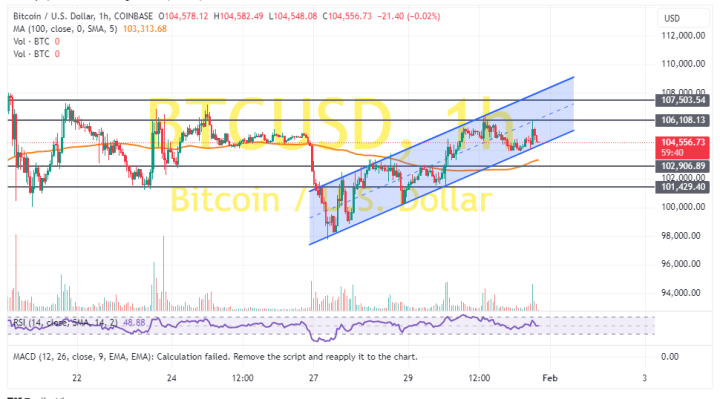
Technically, the BTC/USD trades within an ascending channel formation in the 60-minute chart. The 14-hour RSI continues to trade centrally leaving room for the bulls and bears to pounce.
Therefore, the bulls will target potential upward movement at about $106,108 or higher at $107,503. On the other hand, the bears will look to pounce on pullbacks at about $102,906 or lower at $101,429.
Bitcoin Price Technical Analysis (the Daily Chart)
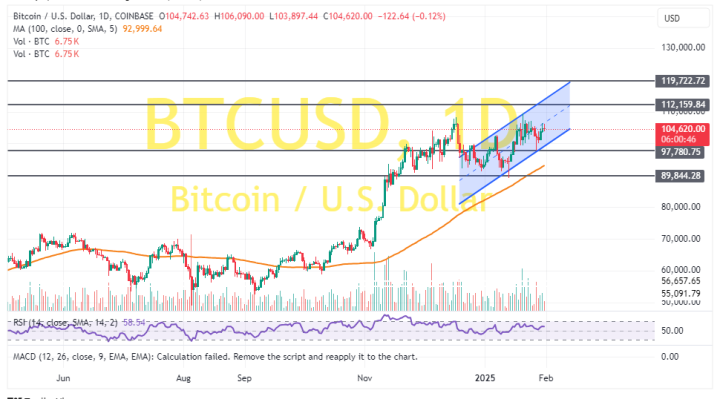
In the daily chart, the price of the pioneer cryptocurrency trades within an ascending channel formation. The 14-day RSI also supports a bullish bias as it moves closer to the overbought conditions.
Therefore, the bulls will look to stretch the current gains toward $112,159 or higher to $119,722. On the other hand, the bears will look to pounce on pullbacks at about $97,780 or lower at $89,844.