
The bitcoin price on Friday pulled back from session highs of about $43,734 to trade at about $42,973 following the latest round of data. The BTC/USD continues to trade within a sideways channel formation in the 60-minute chart.
Friday’s pullback pushed the bitcoin price closer to the 100-hour moving average line. However, the price of the pioneer cryptocurrency still seems to have more room left to run before reaching the oversold levels of the 14-hour RSI.
Bitcoin Price Fundamentals Overview

From a fundamental perspective, Bitcoin is trading at the back of a relatively busy period in the US market. On Friday, the US nonfarm payrolls for January outperformed the expected job count of 180k with a significantly higher tally of 353k. The unemployment rate for the period also outshone the forecasted rate of 3.8% with a rate of 3.7% unchanged from December.
On the other hand, the average hourly wage for the month exceeded the (MoM) change of 0.3% with a change of 0.6%. The (YoY) equivalent also beat the estimate of 4.1% with a change of 4.5%. Elsewhere, the Michigan Consumer Sentiment Index for January outshone the expectation of 78.9 with a reading of 79.
On Thursday, the initial jobless claims for the week ending January 26 missed the forecasted claim count of 212k with a significantly higher tally of 224k. The preliminary unit labour costs for Q4 also missed 1.7% with a change of 0.5%, while the nonfarm productivity beat 2.5% with a change of 3.2%. On the other hand, the ISM Manufacturing PMI for January beat the expectation of 47 with a reading of 49.1.
Bitcoin Price Technical Analysis (the 60-min Chart)
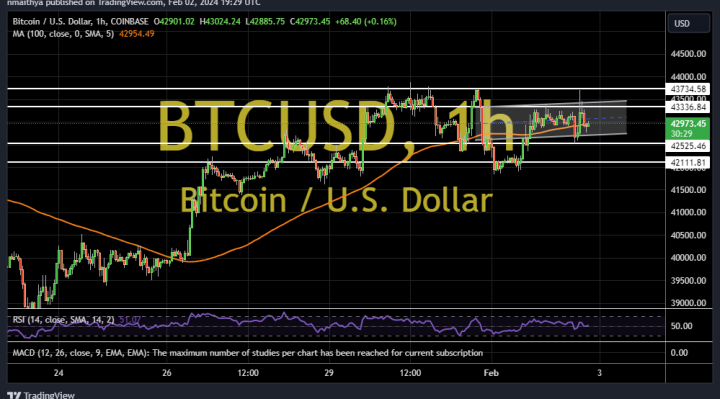
Technically, the price of bitcoin is trading within a sideways channel formation in the 60-minute chart. The 14-hour RSI also has a lot of room left to run into either side of the median line.
Therefore, the bears will target extended pullbacks at about $42,525 or lower at $42,111. On the other hand, the bulls will look to pounce on rebounds at about $43,336 or higher at $43,734.
Bitcoin Price Technical Analysis (the Daily Chart)
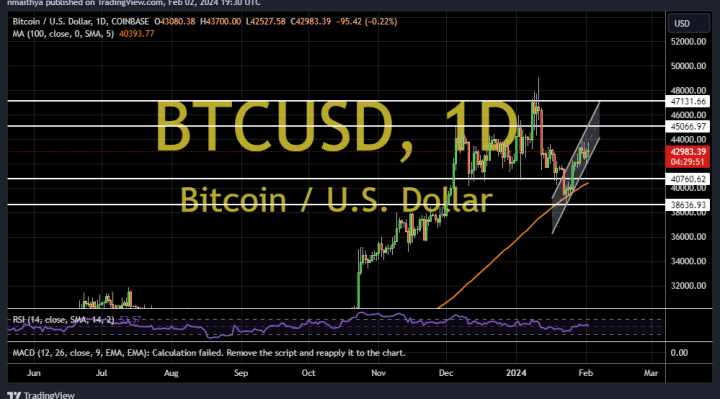
In the daily chart, the price of the pioneer cryptocurrency is trading within a sharply ascending channel formation. The 14-day RSI also supports a bullish bias as it moves closer to overbought conditions.
Therefore, the bulls will be looking to extend the current rally towards $45,065 or higher to $47,131. On the other hand, the bears will target pullbacks at about $40,760 or lower at $38,636.