
On Friday, the bitcoin price pulled back off the session highs of about $56,989 to trade at about $54,349 after the latest economic data. The BTC/USD trades within a descending channel formation in the 60-minute chart.
Bitcoin has now plummeted to trade several levels below the 100-hour moving average line. As a result, the price of the pioneer cryptocurrency is on the verge of entering the oversold levels of the 14-hour RSI.
Bitcoin Price Fundamentals Overview

From a fundamental perspective, the BTC/USD trades during a relatively busy period in the US market. On Friday, the US nonfarm payrolls for August missed the expectation of 160k with a tally of 142k, up from the preceding month’s equivalent of 89k.
The unemployment rate for the month was in line with the estimate of 4.2%, down from 4.3% in July. The average hourly wage growth for the month was 0.4% (MoM) up from 0.2% in July, beating the forecast of 0.3%. The (YoY) equivalent also improved to 3.8%, up from 3.6%, ahead of the forecasted growth rate of 3.7%.
Earlier in the week, the ADP employment change for August fell short of the forecasted change of 145k with a change of 99k, while the initial jobless claims for the week ending August 30 came in slightly lower than expected with a claim count of 227k versus a forecast of 230k.
The nonfarm productivity for Q2 beat expectations of 2.3% with a change of 2.5%, while unit labour costs for the period missed 0.9% with a change of 0.4%. The ISM Services PMI for August exceeded expectations of 51.1 with a reading of 51.5, while the S&P Global Composite PMI beat 54.1 with 54.6.
Bitcoin Price Technical Analysis (the 60-min Chart)
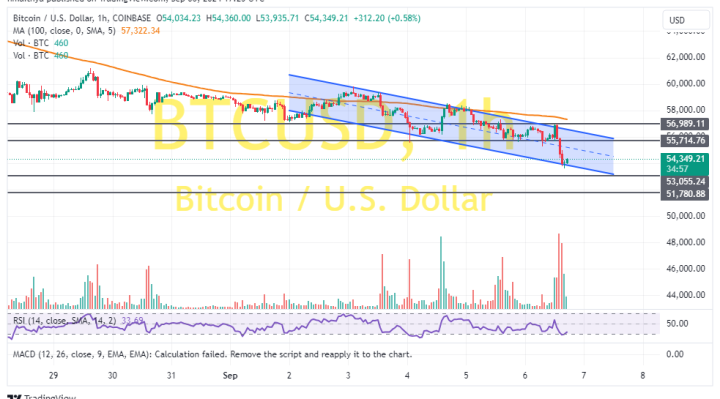
Technically, the price of the pioneer cryptocurrency trades within a descending channel formation in the 60-minute chart. The 14-hour RSI has also pulled back to move closer to oversold conditions.
Therefore, the bears will be targeting extended pullbacks at about $53,055 or lower at $51,780. On the other hand, the bulls will look to pounce on rebounds at about $55,714 or higher at $56,989.
Bitcoin Price Technical Analysis (the Daily Chart)
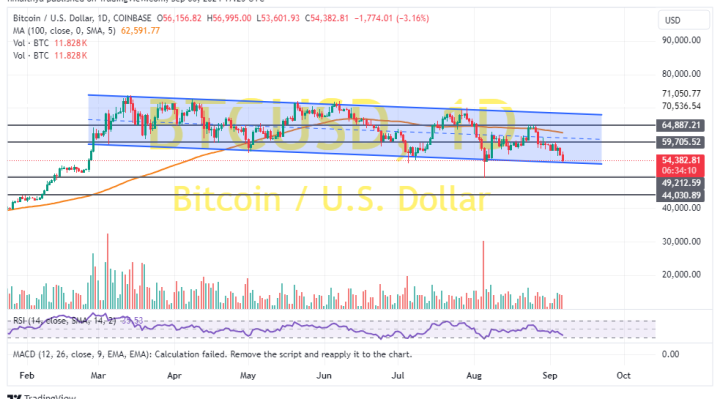
In the daily chart, the BTC/USD trades within a sideways channel formation. However, the 14-day RSI has recently pulled back to move closer to the oversold conditions of the indicator.
Therefore, the bears will be targeting long-term profits at about $49,212 or lower at $44,000. On the other hand, the bulls will look to pounce on rebounds at about $59,705 or higher at $64,887.