
The Bitcoin price on Friday pulled back off the session highs of about $63,467 to trade at about $60,991 after the latest round of data. The BTC/USD has completed a downward breakout from an ascending channel formation in the 60-minute chart.
Bitcoin has now plummeted to trade below the 100-hour moving average line. As a result, the price of the pioneer cryptocurrency appears to be on the verge of entering the oversold conditions in the 14-hour RSI.
Bitcoin Price Fundamentals Overview

From a fundamental perspective, the BTC/USD is trading at the back of a relatively busy period in the US market. On Friday, the preliminary Michigan Consumer Sentiment Index for May missed the expectation of 76 with a reading of 67.4, down from 77.2, while the preliminary UoM 5-year inflation expectations for the period improved to 3.1% up from 3%.
On Thursday, the US initial jobless claims for the week ending May 3 fell short of the forecasted claim count of 210k with a tally of 231k, while the continuing claims for the preceding week beat 1.79 million with a slightly lower claim count of 1.785 million.
Earlier in the week, the US consumer credit change for March missed the expectation of $15 billion with a change of $6.27 billion, down from the preceding month’s equivalent of $15.02 billion.
Elsewhere, the pioneer cryptocurrency still continues to benefit from mainstream adoption with European authorities planning to add to the $12 TRILLION market for UCITS, the equivalent of US ETFs. The US and Hong Kong have already approved several spot Bitcoin ETFs.
Bitcoin Price Technical Analysis (the 60-min Chart)
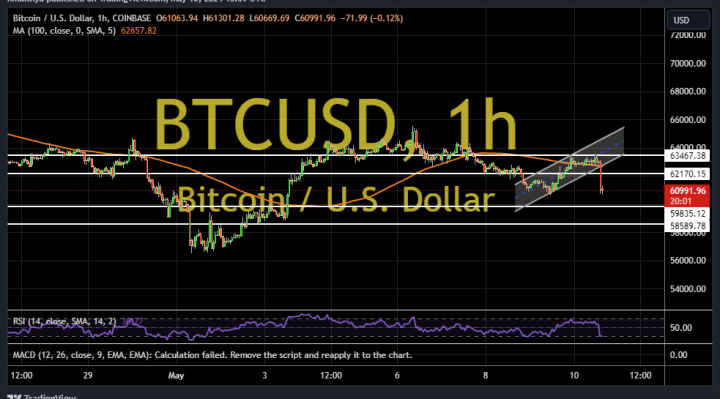
Technically, the Bitcoin price appears to have recently completed a downward breakout from an ascending channel formation. The 14-hour RSI has also pulled back to move closet to oversold conditions.
Therefore, the bears will be targeting extended declines at about $59,835 or lower at $58,589. On the other hand, the bulls will look to pounce on rebounds at about $62,170 or higher at $63,467.
Bitcoin Price Technical Analysis (the Daily Chart)
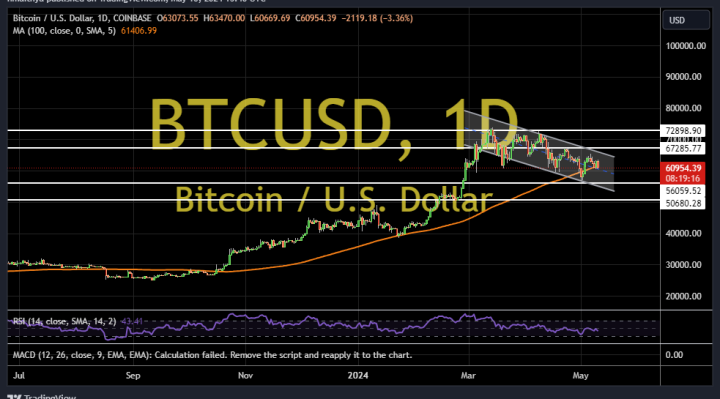
In the daily chart, the price of the pioneer cryptocurrency appears to be trading within a descending channel formation. However, the 14-day RSI has recently bounced back to avoid falling into oversold conditions.
Therefore, the bulls will be targeting extended rebounds at about $67,285 or higher at $72,898. On the other hand, the bears will be looking to extend the declines toward $56,059 or lower to $50,680.