
The bitcoin price on Thursday pulled back off the session highs of about $29,700 to trade at about $29,430 after US inflation data. The BTC/USD appears to be trading within a descending channel formation in the 60-min chart.
The pioneer cryptocurrency has now plummeted to touch the 100-hour moving average line. However, the Bitcoin price still seems to have more room left to run before reaching the oversold levels of the 14-hour RSI.
Bitcoin Price Fundamentals Overview

From a fundamental perspective, the pioneer cryptocurrency is trading at the back of a relatively busy period in the US market. On Thursday, the US consumer price index for July missed the expected (YoY) change of 3.3% with a change of 3.2%, up from the previous month’s equivalent of 3%.
The (MoM) equivalent matched the expected rate of 0.2%. On the other hand, the consumer price index ex-food and energy for the month missed the (YoY) forecast of 4.8% with a rate of 4.7%. This was a slight decline from the previous month’s equivalent of 4.8%.
Elsewhere, the initial jobless claims for the period ending Aug 4 missed the expected claim count of 230k with a tally of 248k. The continuing claims for the preceding week outshone the expectation of 1.71 million with a tally of 1.684 million. The monthly budget sentiment for July missed the expected reading of $-109.3 billion with a reading of $-221 million.
Bitcoin Price Technical Analysis (the 60-min Chart)
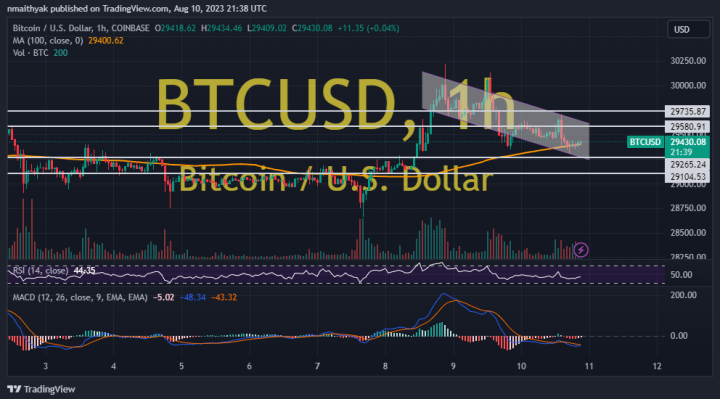
Technically, the bitcoin price appears to be trading within a descending channel formation in the 60-min chart. The MACD appears to be indecisive with the bears slightly hedging the battle.
Therefore, the bears will be targeting short-term pullbacks at about $29,265 or lower at $29,104. On the other hand, the bulls will look to pounce on profits at about $29,580 or higher at $29,735.
Bitcoin Price Technical Analysis (the Daily Chart)
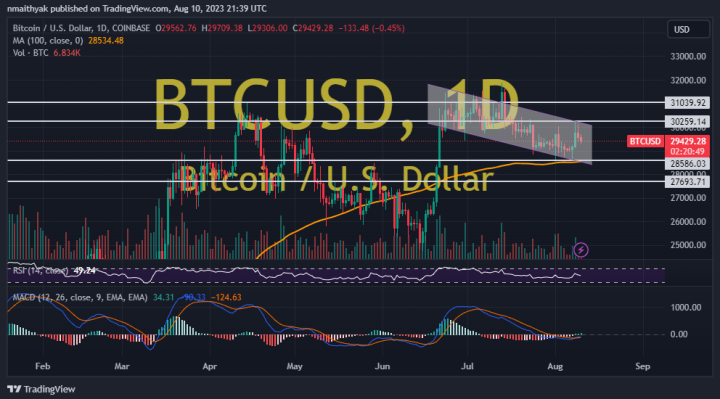
In the daily chart, the price of the pioneer cryptocurrency also seems to be trading within a descending channel formation. The MACD indicates an impending upward overlap albeit lacking momentum.
Therefore, the bulls will be looking to stretch the current rebound toward $30,259 or higher at $31,039. On the other hand, the bears will look to pounce on profits at about $28,586 or lower at $27,693.