
The Bitcoin price on Thursday bounced off the trendline support at about $42,756 to trade at about $44,061 following Wednesday’s sharp decline. The BTC/USD appears to be trading within an ascending channel formation in the 60-min chart.
Bitcoin has now advanced to trade slightly above the 100-hour moving average line. As a result, the price of the pioneer cryptocurrency appears to be moving closer to the overbought levels of the 14-hour RSI.
Bitcoin Price Fundamentals Overview

From a fundamental perspective, Bitcoin is trading at the back of a relatively busy period in the market. On Wednesday, crypto platform Matrixport published a report saying that the SEC will reject all Spot Bitcoin ETF applications, due to political reasons. The publication sent the BTC/USD price tumbling 9% before Thursday’s rebound. Most reports still indicate that the SEC is likely to approve multiple Spot Bitcoin ETF applications within weeks.
In the latest round of US economic data, the ADP employment change for December outperformed the expected job count of 115k with a significantly higher tally of 164k. The initial jobless claims for the week ending December 29 also outshone the forecast of 216k with a lower tally of 202k, while the continuing claims for the preceding week beat 1.882 million with 1.855 million. Elsewhere, the S&P global composite PMI for December missed the expectation of 51 with a reading of 50.9. Traders will be looking forward to the US unemployment data and the nonfarm payrolls on Friday.
Bitcoin Price Technical Analysis (the 60-min Chart)
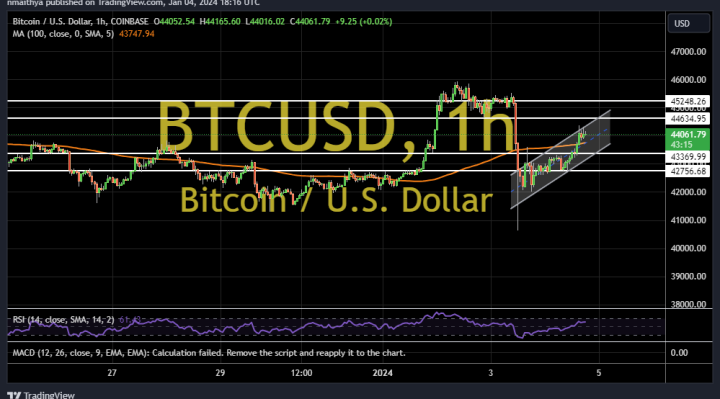
Technically, the bitcoin price appears to be trading within an ascending channel formation in the 60-minute chart. The recent rebound pushed the BTC/USD closer to the overbought levels of the 14-hour RSI.
Therefore, the bulls will be targeting extended rebounds at about $44,634 or higher at $45,248. On the other hand, the bears will look to pounce on pullbacks at about $43,369 or lower at $42,756.
Bitcoin Price Technical Analysis (the Daily Chart)
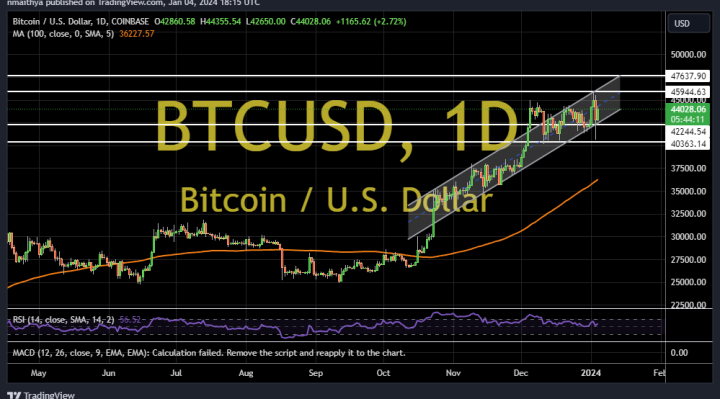
In the daily chart, the price of bitcoin also appears to be trading within an ascending channel formation. However, the 14-day RSI appears to have recently pulled back to avoid advancing into overbought conditions.
Therefore, the bears will be targeting extended pullbacks at about $42,244 or lower at $40,363. On the other hand, the bulls will be targeting long-term profits at about $45,944 or higher at $47,637.