
On Friday, Friday, the bitcoin price extended gains to a new 4-month high of about $104,352 before pulling back to 102,954. The BTC/USD trades within an ascending channel formation in the 60-minute chart.
The price of the pioneer cryptocurrency has now rallied to trade several levels above the 100-hour moving average line. Friday’s afternoon pullback helped the bitcoin price to recover from the overbought levels of the 14-hour RSI.
Bitcoin Price Fundamentals Overview

From a fundamental perspective, the Bitcoin price trades during a relatively busy period in the U.S. market. On Thursday, the initial jobless claims for the week ending May 2, came in lower than expected with 228k versus a forecast of 230k, down from the preceding week’s claim count of 241k.
The preliminary nonfarm productivity for Q1 missed the expected change of -0.4% with a change of -0.8%, while the preliminary unit labour costs for the quarter beat the estimate of 5.3% with a change of 5.7%.
Earlier in the week, the U.S. Federal Reserve chose to keep the base interest rate unchanged at 4.5% in line with expectations. On the other hand, the ISM Services PMI for April improved slightly to 51.6, up from 50.8, beating the forecast of 50.6.
The S&P Global Composite PMI for the period fell short of 51.2 with a reading of 50.6, down from 51.2. The S&P Global Services PMI for the period also missed 51.4 with 50.8, down from 51.4, while wholesale inventories for March outperformed the expected change of 0.5% with a change of 0.3%.
Bitcoin Price Technical Analysis (the 60-min Chart)
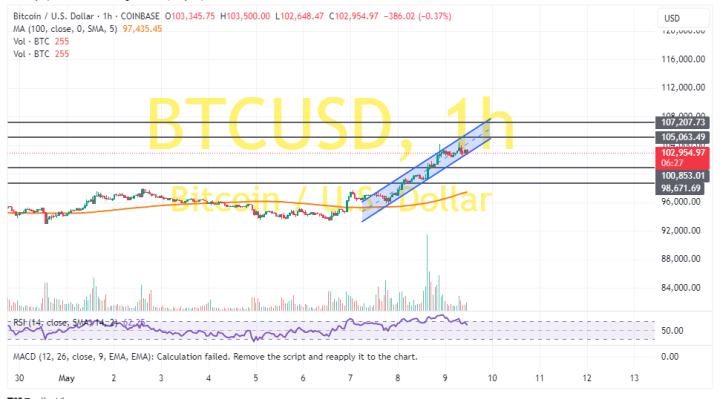
Technically, the Bitcoin price trades within an ascending channel formation in the 60-minute chart. However, the 14-hour RSI has recently pulled back to recover from overbought conditions.
Therefore, the bears will look to extend the current pullback towards $100,853 or lower to $98,671. On the other hand, the bulls will look to ride the current rally towards $105,063 or higher to $107,207.
Bitcoin Price Technical Analysis (the Daily Chart)
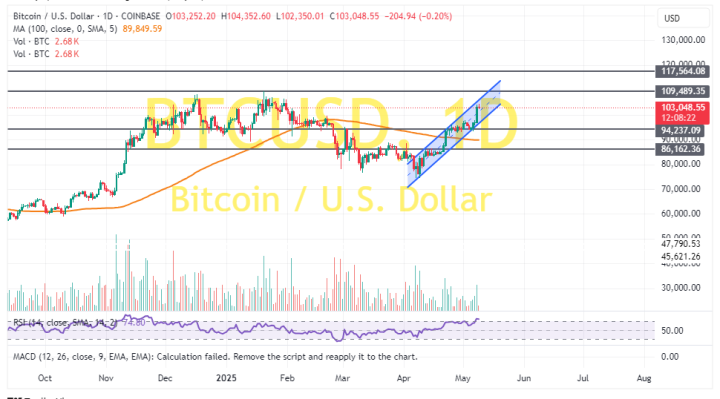
In the daily chart, the BTC/USD trades within an ascending channel formation. The 14-day RSI also supports a long-term bullish bias after entering overbought conditions.
Therefore, the bulls will look to ride the current rally towards $109,489 or higher to $117,564. On the other hand, the bears will look to pounce on pullbacks at about $94,237 or lower at $86,162.