
The Brent Oil increased today and has managed to resume the yesterday’s bullish candle. Price increased somehow surprisingly as the US Crude Oil Inventories have increased surprisingly in the previous week.
Price has turned to the upside and now is retesting two important resistance levels. Technically, it is somehow expected to drop after the failure to stabilize above a dynamic resistance.

However, you should know that the perspective remains bullish on the Daily chart despite the minor drop, the price is trapped within an ascending channel. Maybe the Brent Oil is increasing and profits by the USD’s drop. The greenback goes down as the USDX has plunged today again.
Brent Oil has managed to climb above the 70.20 level and could approach the 71.37 former higher if the USD/CAD will reach new lows. The Loonie appreciated versus the USD, I’ve said in the previous week that the USD/CAD could be attracted by a dynamic support.
The oil price increased and ignored the Crude Levels amazing increase, were reported at 6.8 million barrels in the previous week. The indicator has come much above the 0.1M estimate and much above the -1.1M in the former reading period.
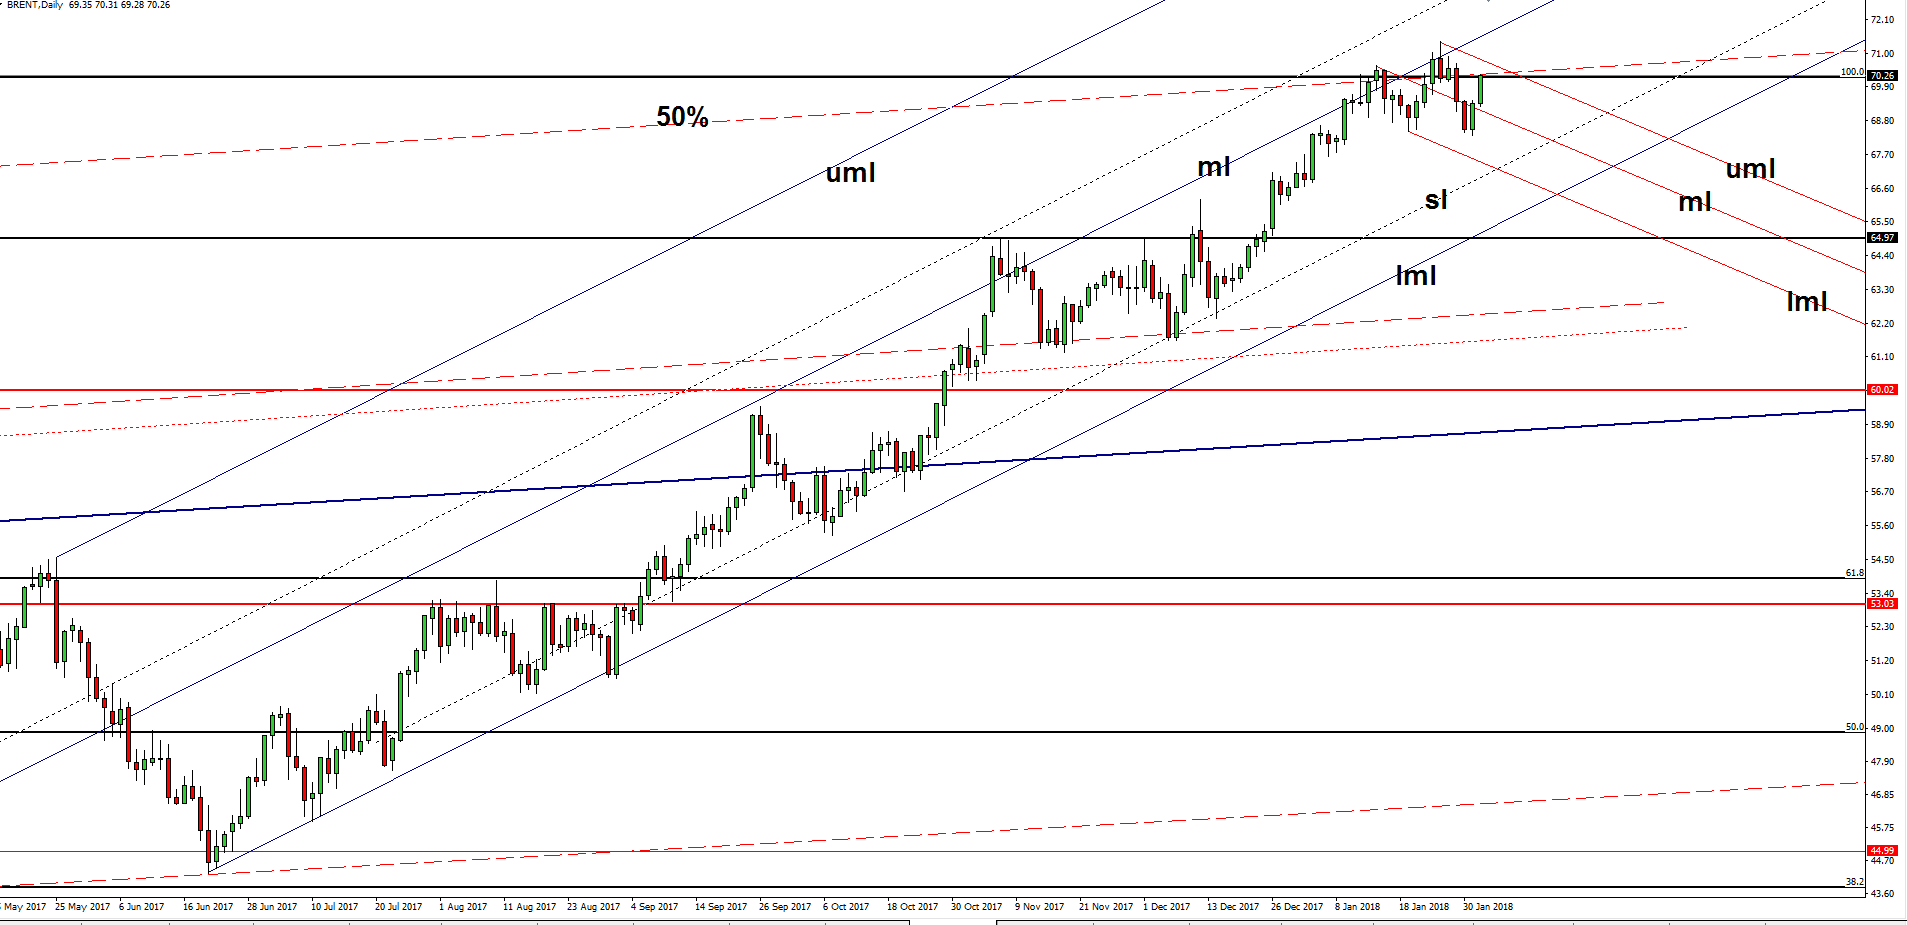
You can see that the rate has come back higher on the short term. It is pressuring the 100% Fibonacci level and the 50% Fibonacci line (ascending dotted line). It is expected to approach and reach the upper median line (uml) of the minor descending pitchfork after the false breakdown below the median line (ml).
A valid breakout above the mentioned resistance levels will signal an increase towards the median line (ml) of the blue ascending pitchfork. Price will become strongly bullish only after a valid breakout above the median line (ml) of the ascending pitchfork. A larger drop will appear only after a valid breakdown below the sliding line (sl).