
KO Long-term outlook
Several downgrades were given to KO between December – February. Deutsche Bank, Morgan Stanley, Goldman Sachs, and Well’s Fargo among the analysts who downgraded KO outlook. The outlook for company grows dimmer as the mature market slowly switches to a healthier option.

The challenge persist and if the company cannot find a better healthier option, it will run out of business in several years. Declining sales has been a problem. The Same problem also faced by competitor Pepsi Co which already tried to beef up its sales in guilt-free drinks, the company said 45% of its revenue generated from the products.
Click here to see KO December analysis
New Month
Monthly chart
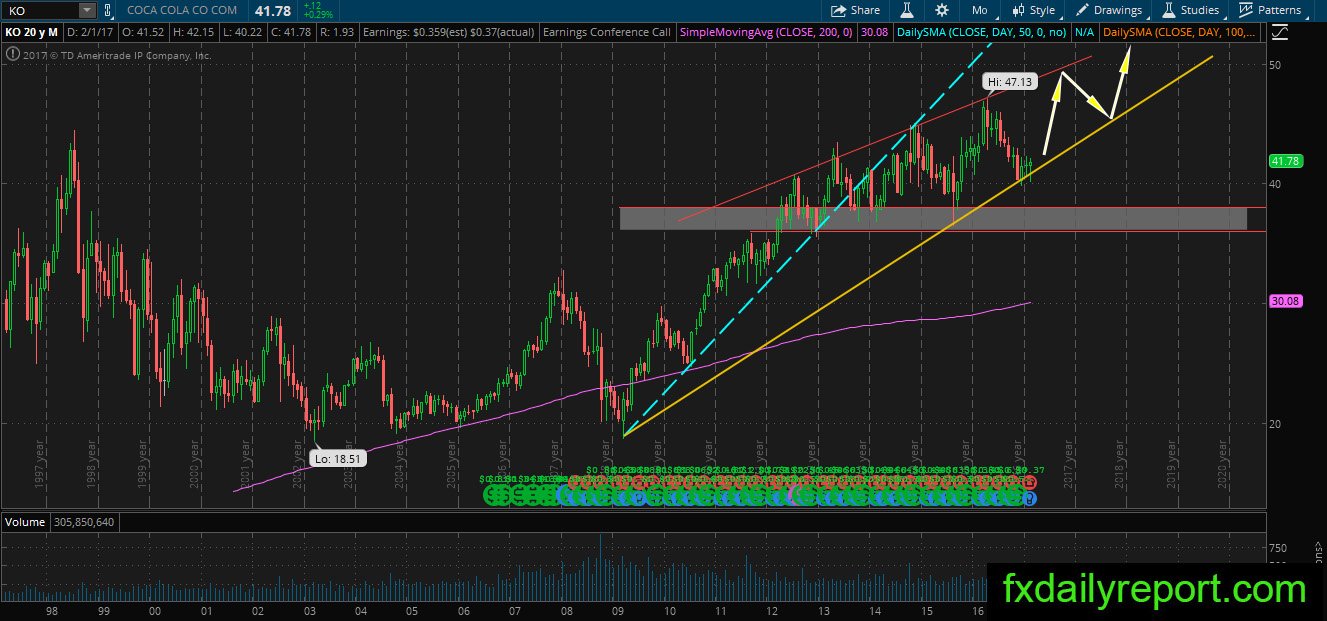
The table turned for KO as the price stay above the trendline. Downward pressure still present but the trendline manage to hold the decline of the price. If bounce happen and the price thrust above $42.50, traders might see the start of a new bullish trend.
Weekly chart

Bottom formed on the weekly chart, and the price is moving between $40 – $42.25. The next movement requires a break either side and traders still favor bullish break above $42.25.
Daily chart
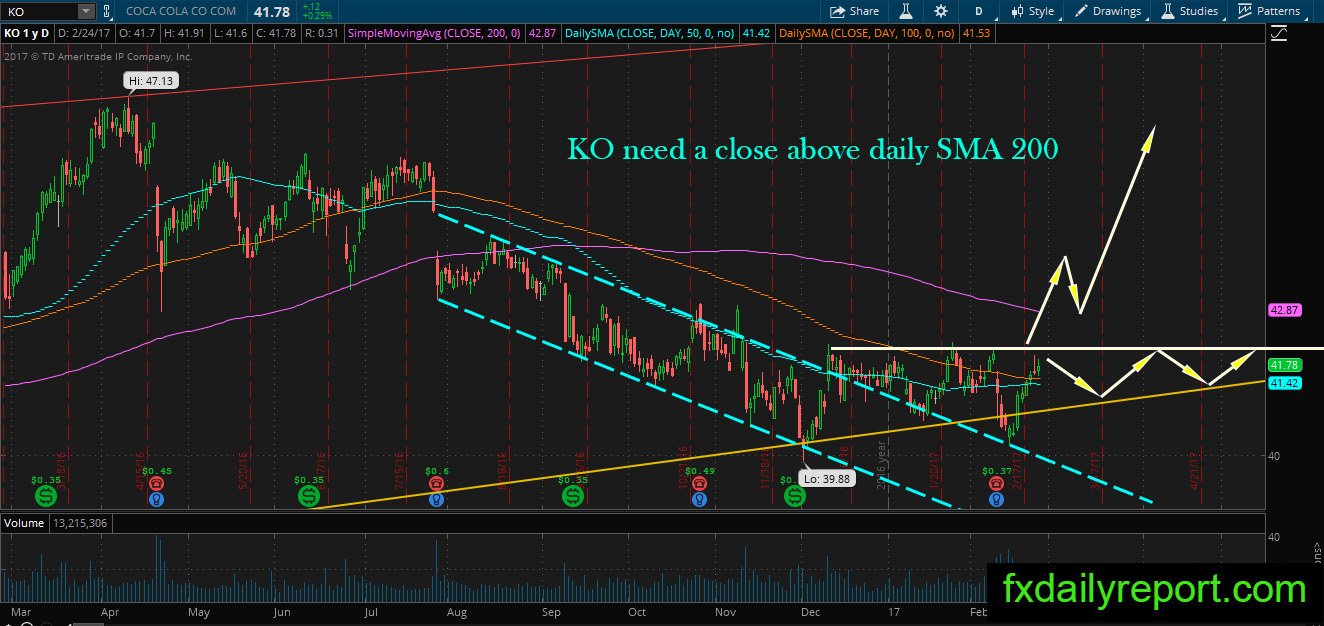
KO need a close above its daily SMA 200 to overturn the bearish trend. The price formed triangle formation with a top at $42 – $42.25, and a close above the range will meet daily SMA 200 resistance. Although the outlook is bearish, we have a break above bearish blue channel which diminishes the bearish pressure in the daily chart.
Trade plan
A long position is best taken near the long-term trendline or after a break above $42.25 and daily SMA 200.
A short position from $42 – $42.25 is the first choice for the bear. A break and re-test of the long-term trendline is the second best option for the bear.