
KO Long-term outlook
Coca-Cola receives upgrade from Well’s Fargo this month. The upgrade from “Market Perform” to “Outperform” awarded for Coca cola success overseas and its effort to expand the beverages product lines. However, the most interesting note given by Well’s Fargo analysis is the speculation the company might venture into alcoholic beverages. There is no confirmation yet on this speculation.
In November, Coca-Cola held its first investor day since seven years ago. CEO James Quincey emphasized KO new strategies to be a total beverages company. The company wants participation in eight beverages consumers drink each day. From financial side, the company outlined target of 4-6% revenue increase through 2020.

On marketing, people recognize Coca-Cola as one of the best in marketing. The company will make a tweak on its current advertising lines, taking the ads to digital marketing.
Click here to see KO October analysis
New Month
Monthly chart
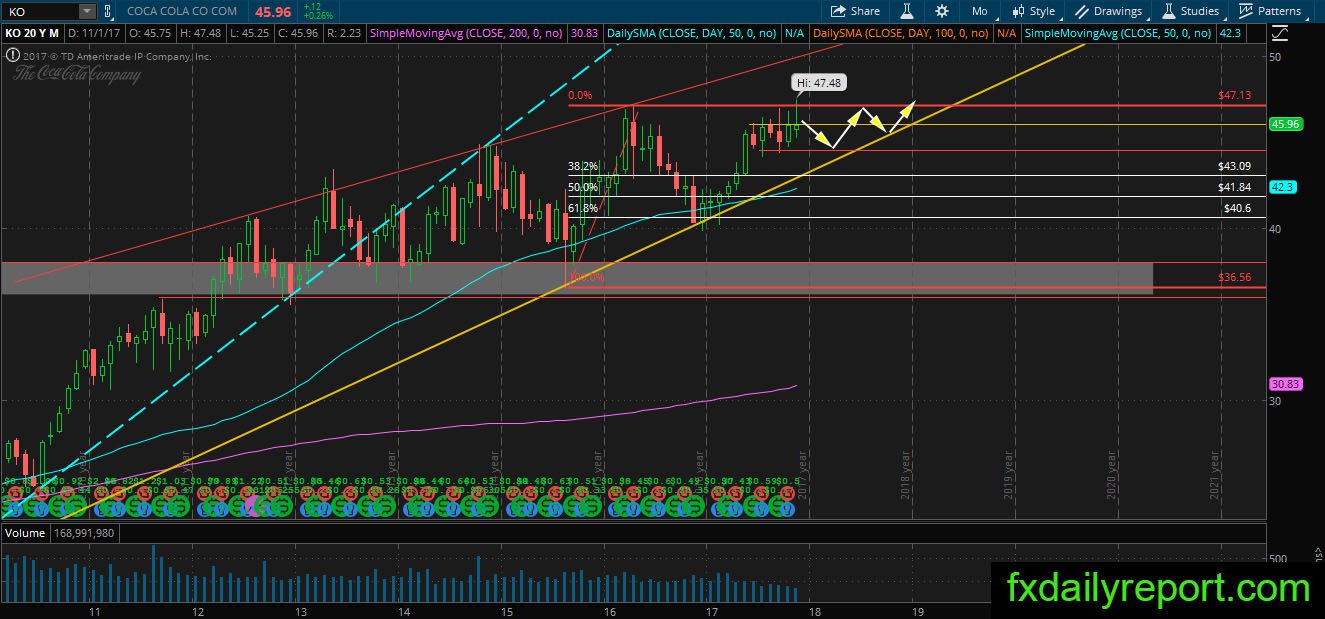
KO print a new record high, but the share prices retreated from the high and looks will close the month below $46.00. If the share prices closed below $46.00, it would be the sixth times KO failed to close above the level. The closure below $46.00 also indicates further sideways movement in the share prices. $44.50 – $45.00 is the area traders could look for a long position.
Weekly chart

The range between $44.50 – $47.00 hold out on KO weekly chart. However, the previous week candlestick pattern formed a bearish engulfing pattern (disregard wick). Up until now, there is no confirmation of the pattern which is safe for the bull. If the bear manages to push the share prices below the candle pattern low, it is possible for KO to move toward $44.50.
Daily chart
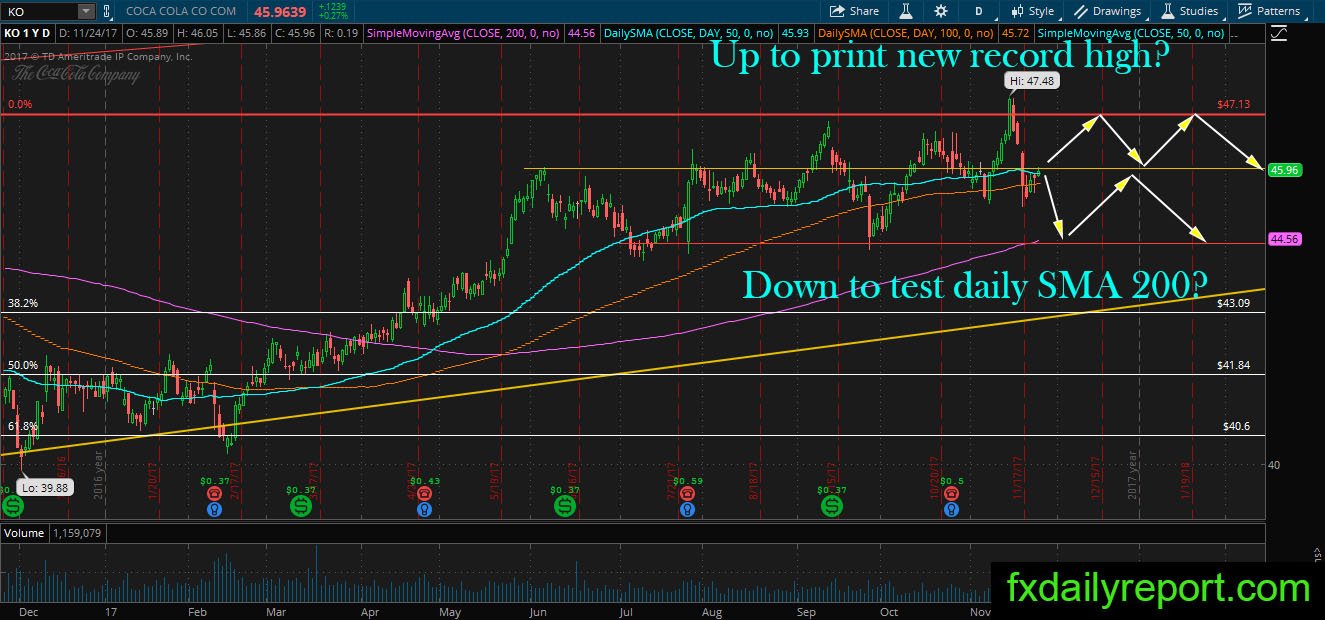
KO share prices supported by its daily averages 50 & 100. The share prices stick near both averages even though momentum pointed down strongly. Will the share prices holding out against the selling pressure and move up to print new record high? Alternatively, will it dive lower toward the daily SMA 200?
Trade plan
A long position might need to wait until the share prices fall further toward $44.50 & daily SMA 200.
A short position also needs to wait until the share prices formed a bearish pattern at $46.00 or $47.00.