
Crude oil long-term projection
OPEC effort to bring crude oil prices higher experiencing major drawbacks. The price currently move lower under major bearish pressure. The downward movement incited by outbreak of coronavirus in China. Recent news show the virus spread across the world and heightened alert. China is one of the major oil consumers and the outbreak of the virus threatens its economy. Fewer economy activities mean less oil consumption.
If the virus spread uncontained and no remedy discovered soon then we could expect a pullback in crude oil prices to continue.

Click here to see Oil December analysis
New Month
Monthly chart
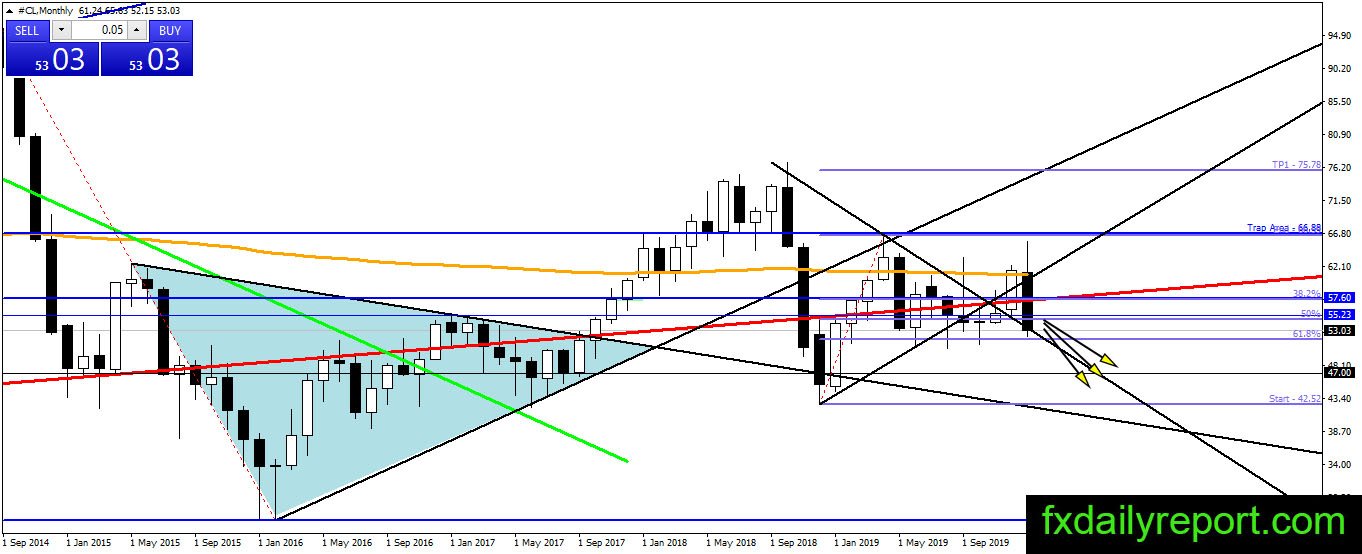
A major bearish reversal happened in crude oil prices as it got rejected near $66.59 resistance level. The price also rejected from the monthly SMA 200. It seems crude oil will close the month as a bearish engulfing pattern and start a long-term bearish movement.
Weekly chart

We are less confident in the long positions in crude oil. The price tumbled below weekly SMA 200 and gapped lower this week. The price just tested the trendline and stick near it. If crude oil could continue lower below 61.8% Fibonacci Retracement level then the long-term trend might change into bearish.
Daily chart
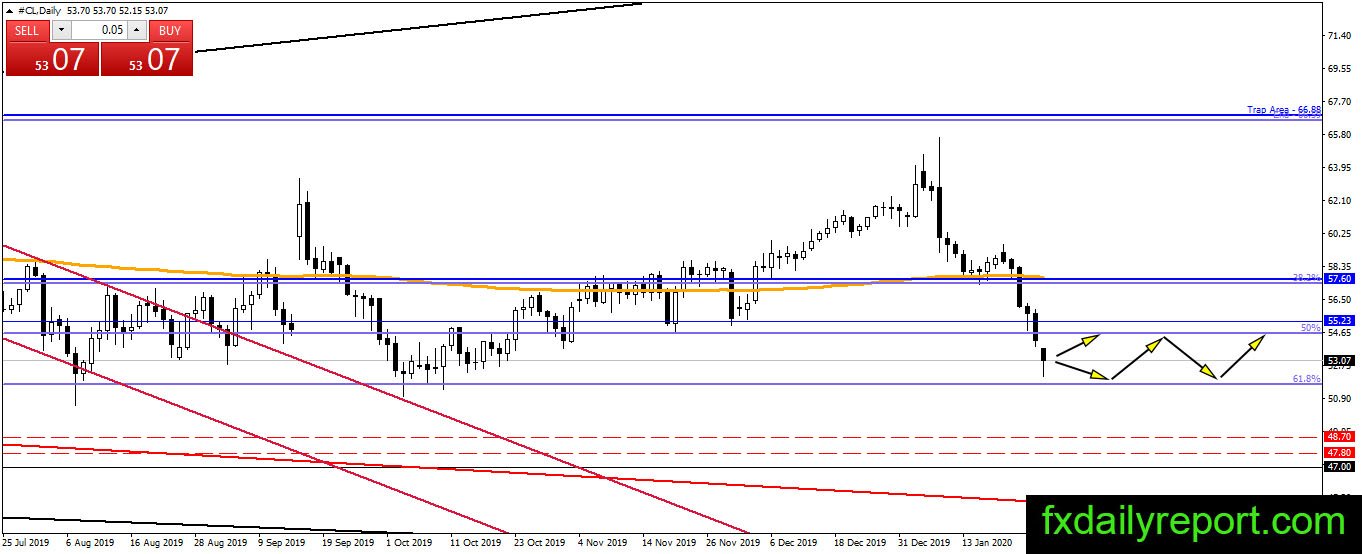
Crude oil is smoothly lower on the daily chart. It has been sixth consecutive days the price move lower. We have no clue where the price will find support yet. However, the 61.8% Fibonacci retracement support level is the level to watch for a possible bounce.
Trade plan
Crude oil moving under major bearish pressure and there is no stop seen yet. Long position strategies might be risky but could be considered near 61.8% Fibonacci retracement level. Short positions could be taken when the price makes an upward correction to test the level around $54.50 – $55.00 (50% Fibonacci retracement)