
Crude oil long-term projection
Crude oil prices’ upward movement seems to have stopped and the price undergo corrections. The war between Russia and Ukraine has not concluded yet and we are into the winter season. Crude oil prices might reverse the bearish pressure or halt the downward price movement in the current time.
However, weak demand caused by China’s lockdown might influence the price movement too. If the economy enters recession next year then crude oil prices could continue the downward movement.
New Month
Monthly chart

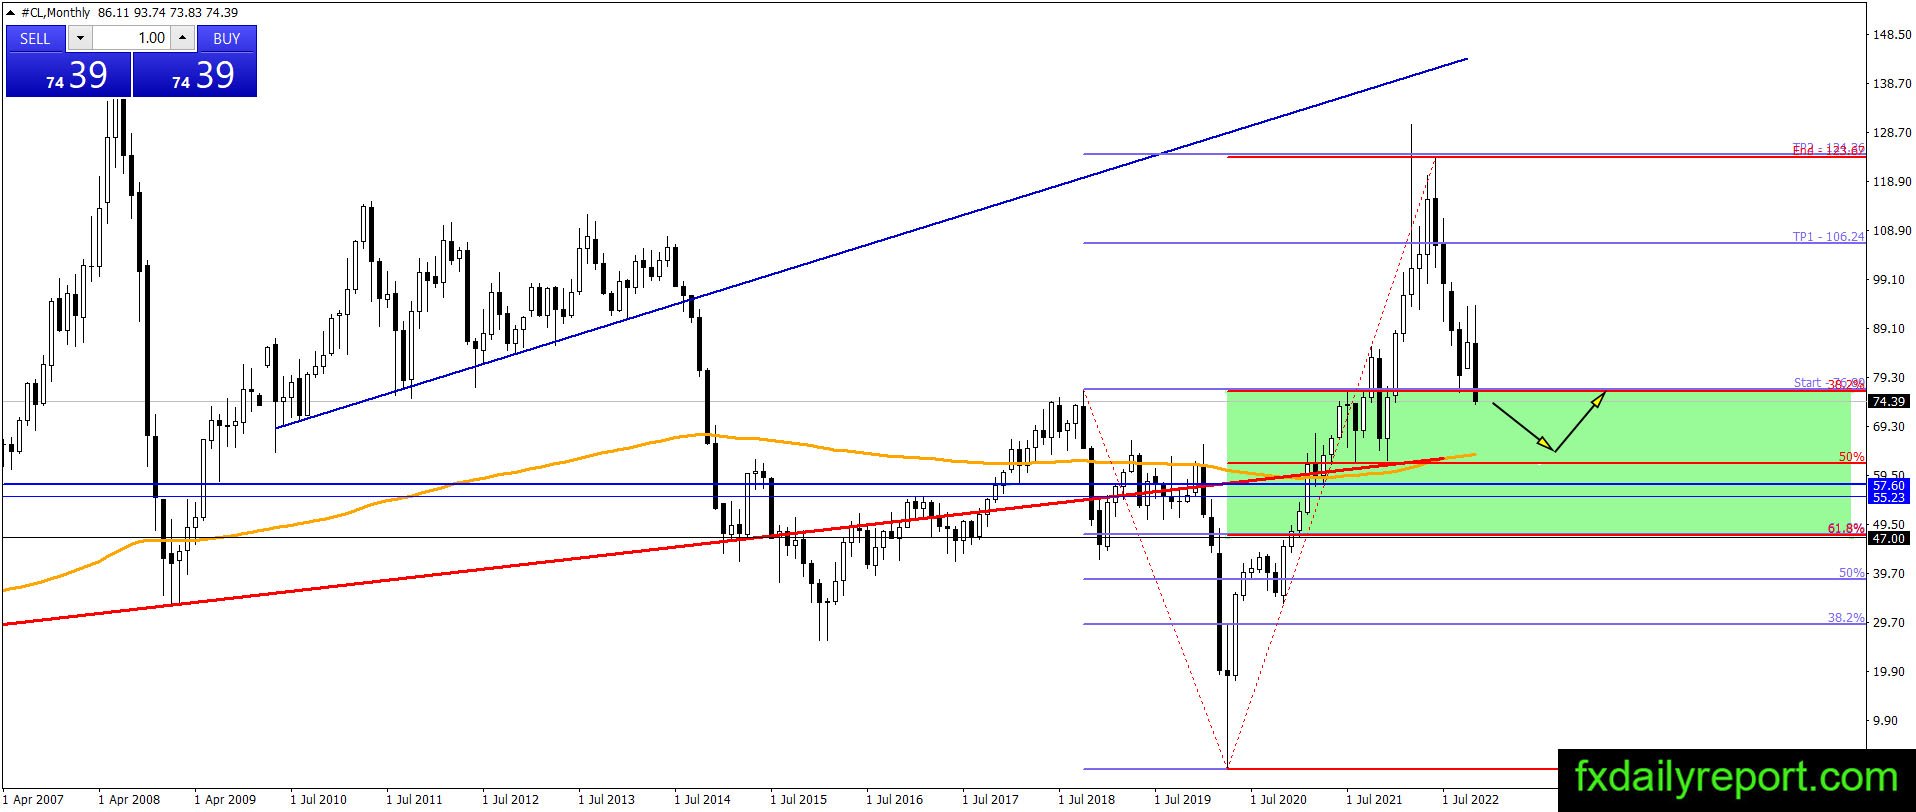
Crude oil prices reached the second Fibonacci extension level and started a bearish movement. The bearish movement currently entering the area between 38.2% – 61.8% Fibonacci Retracement. There is more room for weakness on the monthly chart. If the price continues the bearish movement then it will target the monthly SMA 200 and the 50% retracement level.
Weekly chart
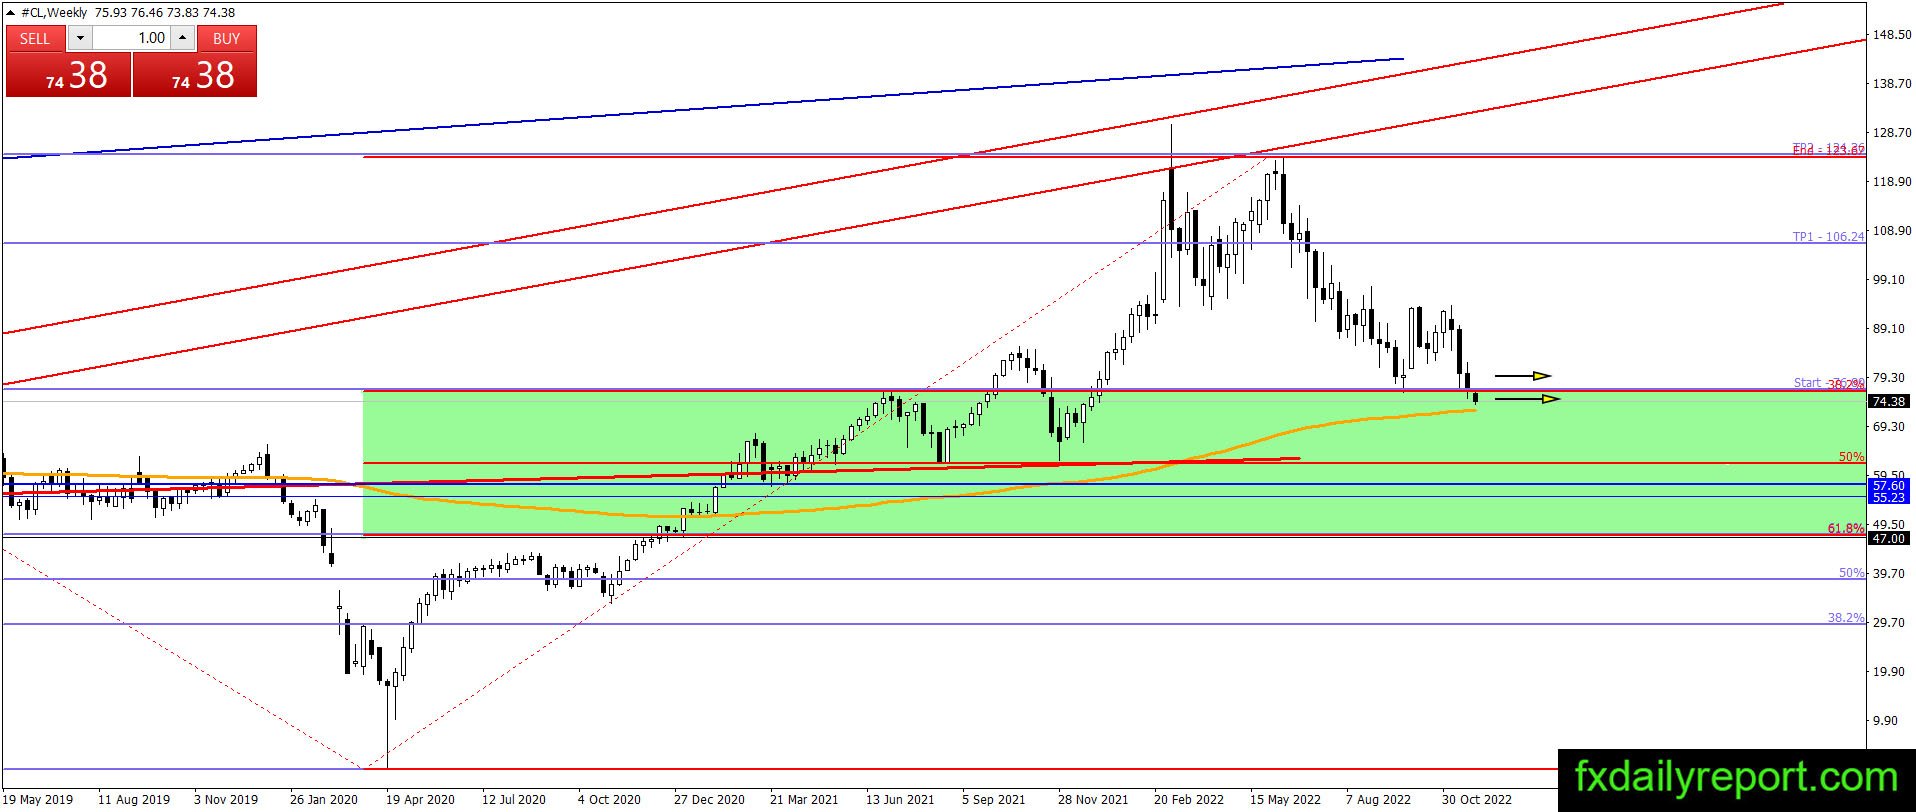
Crude oil prices are trading near the weekly SMA 200 where a bullish reaction might happen. Traders will monitor closely the reaction near the current level. If there are major bullish reactions then traders could enter long positions. Without major bullish reactions, it is better to stay sidelined until the price reaches the next support level.
Daily chart
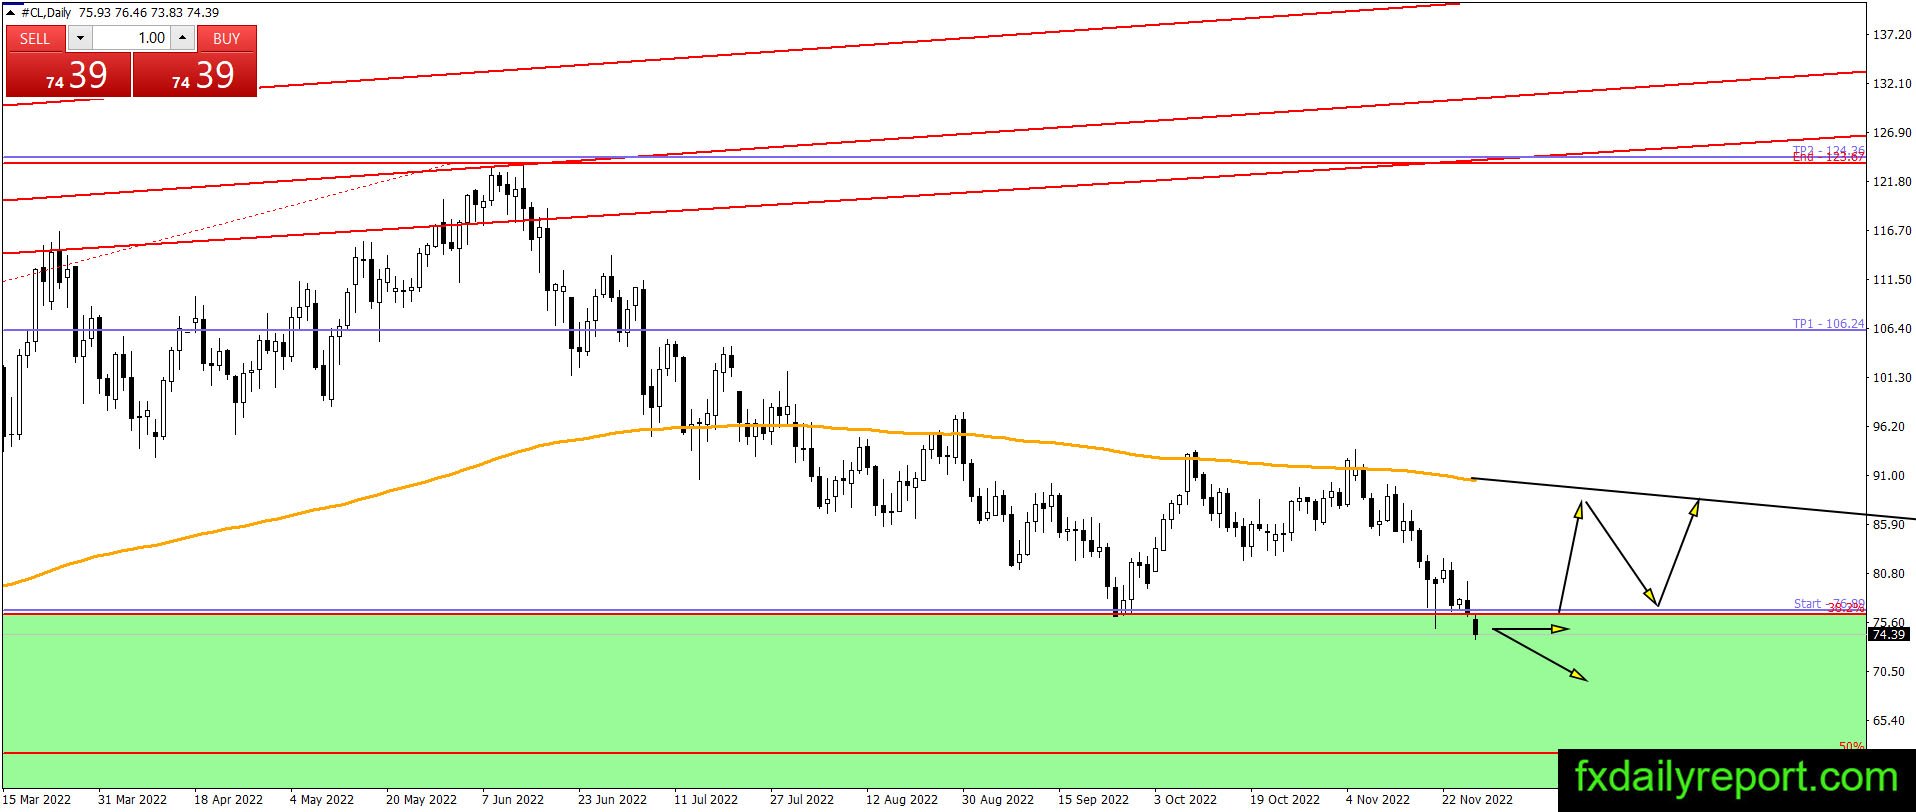
Crude oil prices are mostly lower on the daily chart and print another lower low in today’s trading session. The bearish trend will continue under the current situation which means traders better wait for a better chance to enter long positions. On the lower side, the 50% Fibonacci Retracement level will become the bearish target to watch.
Trade plan
Crude oil prices are in a bearish period but the long-term trend is bullish. At the current time, the bearish movement might continue and traders will wait near support levels. There are no bullish indications yet but traders better avoid short positions. If the price reaches the 50% Fibonacci Retracement level, traders could consider entering long positions.