
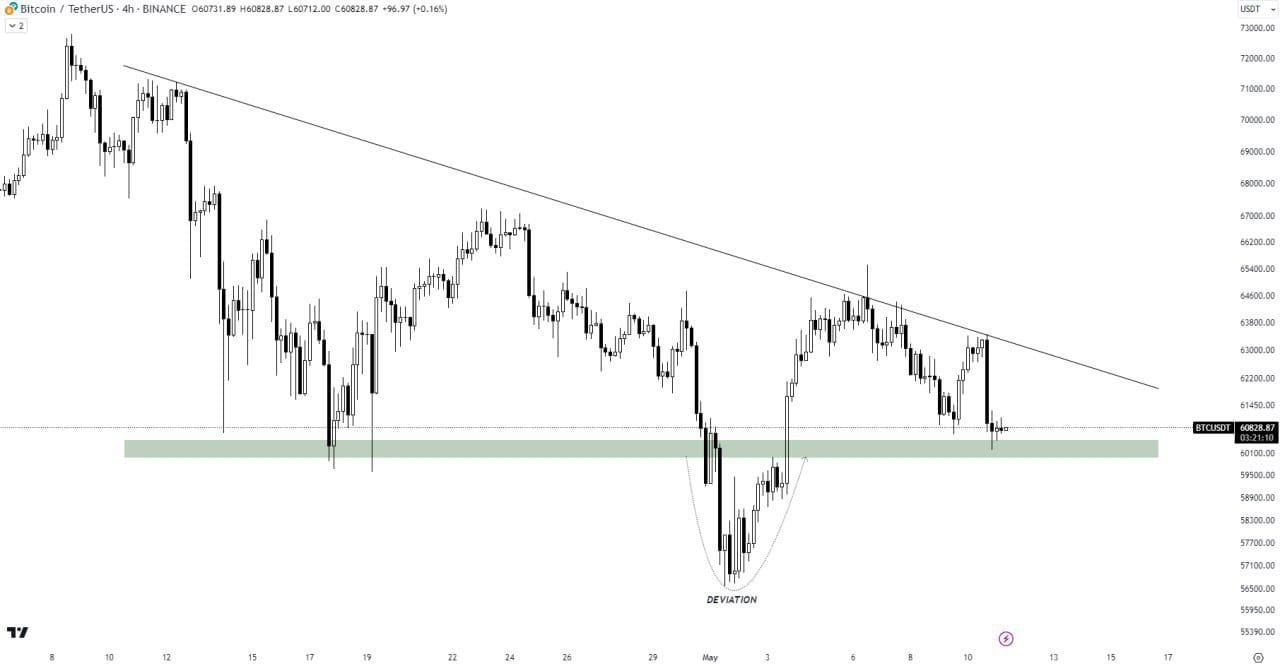
Crypto market is still showing uncertain behaviour and it is moving sideways. The analysis of Bitcoin indicates the bounce zones for $BTC, and the support and resistance level of $ETH and $ALGO. From a short-term point of view, BTC’s price is fluctuating within the range of $60,500 and $63,500. Currently, BTC needs to stay above the $60k horizontal support in order for bulls to reclaim momentum. If it loses this support, it can fall below towards $56k again. ALGO trend analysis showed a retest of the breakout level.
$BTC Bounce Potential: $58.5K-$59.6K Range
There are still chances that BTC can fall below its support and traders are eyeing a potential bounce for BTC around the $58,500 to $59,600 range. It is supported by Fibonacci retracement levels spanning from .618 to .786 on the daily swing and an H4 demand zone. To mitigate risk, a stop-loss below the recent low at $56,500 is advised. Monitoring the strength of the bounce will be crucial for determining whether to hold positions or exit if signs of weakness emerge.
Bitcoin ($BTC) Consolidates Within Falling Wedge Pattern

In the 1D timeframe, Bitcoin ($BTC) is consolidating within a falling wedge pattern. It maintains position above the indicated level. A breach of this level may prompt a retest of the support trendline within the wedge. It serves as a potential trade signal. Traders are advised to monitor this development closely for potential entry or exit opportunities.
$ETH Support Levels and Reversal Strategy
The ongoing downtrend in $ETH is viewed as a correction from its high indicated by the black Fibs. A strong support level is found at 61.8% (2905.75). However, the 100% extension, occurring over 70% of the time. It aligns with the green support zone at 2693.35. A potential reversal scenario involves testing the green support. It is accompanied by RSI divergence.
Cardano ($ADA) Forms Descending Channel
Cardano $ADA is forming a descending channel pattern on the 8h chart. There are strong chances of an upward breakout with a likely target of $0.68. At the moment, ADA is trading $0.44.

$ALGO Support and Resistance Zones
ALGO is currently exhibiting a mixed-to-downward trend. Although it has broken out of a Channel Down pattern, it is now retesting the breakout level. A successful retest could see the price revisiting $0.22. A stop-loss level at $0.175 is recommended by analysts to mitigate risk. Momentum is mixed, with the MACD Line above the Signal Line (bullish), but the RSI below 45 (bearish). Support zones lie at $0.15 and $0.12. On the other hand, resistance zones are at $0.20, $0.25, and $0.30.
Note: This post is for educational purposes and shouldn’t be taken as an investment advice.