
USDX (USD Index)

Lower Non-farm employment data was the final blow in the previous week which drives U.S dollar index lower. The number come out at 156k, 19k lower than 175k expectation. Although the job data were worse than expected, there is hope for the bull as the index close back inside the yellow box area.

In new week, we expect the index to continue its upward movement and move inside the green area. However, if the index managed to close lower below the yellow box in the daily chart, we might see lower test toward 100.
News to watch
07.30 PM, Australia Retail Sales, estimated an increase of 0.4% monthly.
08.30 PM China CPI, consensus 2.2% annually.
For full outlook for this week, you can follow Forex Outlook For The Week 9 – 13 January 2017
Technical Analysis
EUR/USD
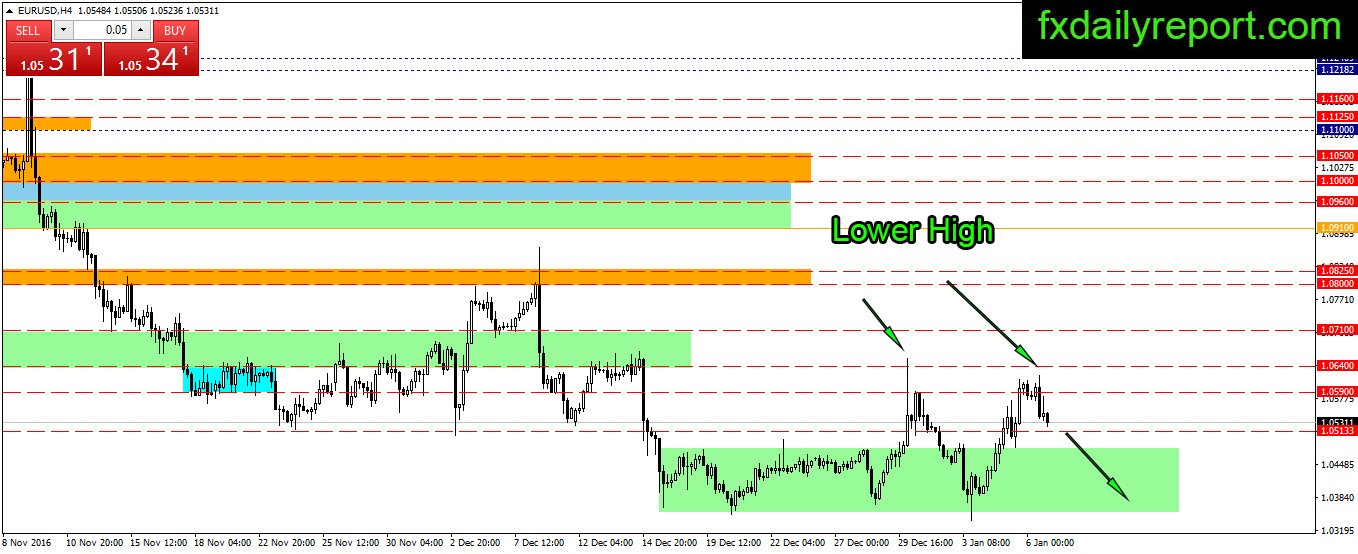
The bullish momentum in EUR/USD fades as the market digested all job data released. It looks like the market ready to switch into the long-term trend where it expects at least three interest-rate increase by the Fed. We might see EUR/USD fall back inside the green area.
Today critical level to watch:
Support: 1.0500, 1.0479, 1.0435, 1.0400
Resistance: 1.0562, 1.0580, 1.0640, 1.0710, 1.0800
GBP/USD
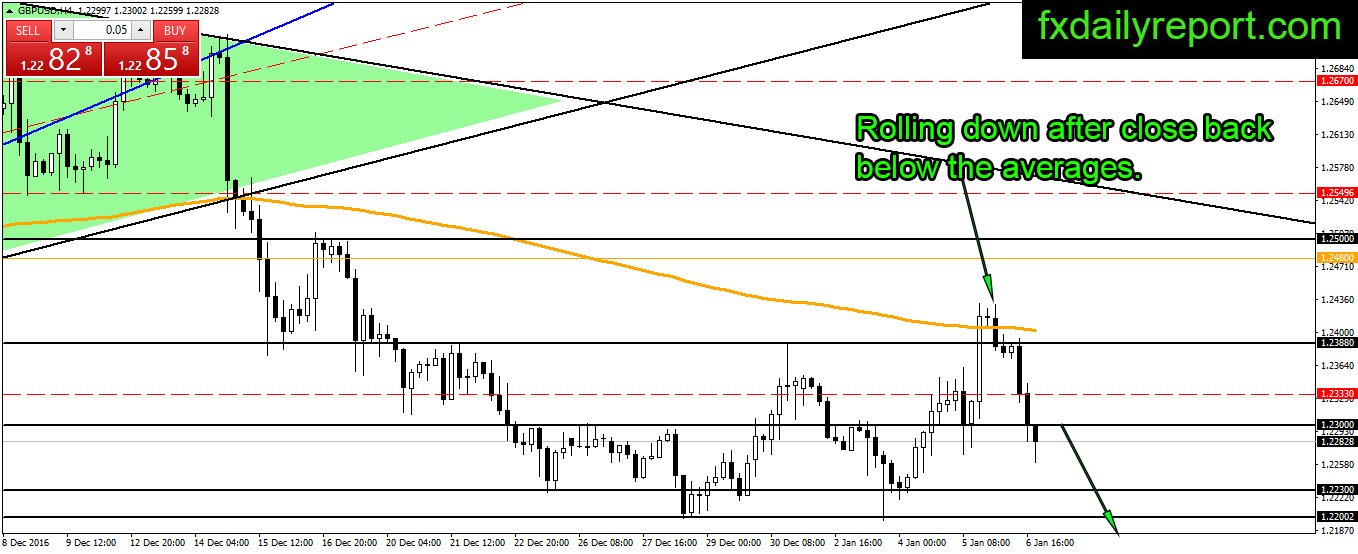
GBP/USD Bear is dominating the pair, and the price keeps moving lower since the close below its SMA 200 in H4 chart. The price might test 1.2200 soon if the bull cannot reverse the selling momentum.
Today critical level to watch:
Support: 1.2270, 1.2230, 1.2200
Resistance: 1.2300, 1.2333, 1.2375, 1.2388, 1.2400
USD/JPY
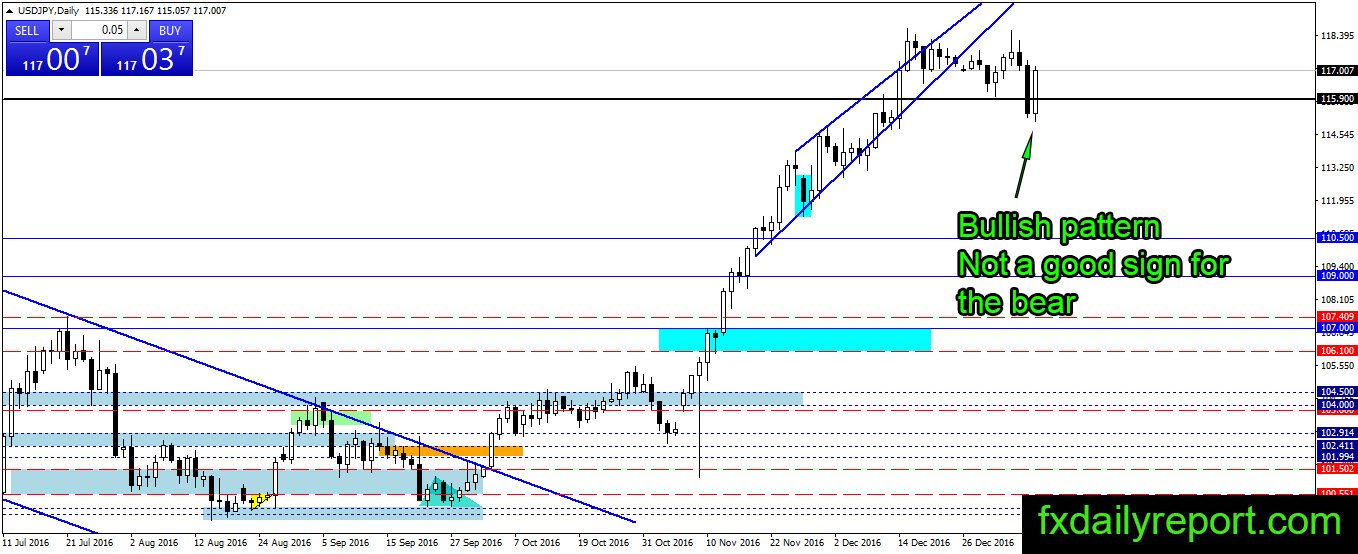

Sharp selling, followed by sharp buying is a good indication that the bull is waiting for the market to play its hand and in the end close the table with a high winning pattern. USD/JPY formed a bullish pattern on the daily chart and looked to continue in coming week. In the long term, it might be possible for the price to reach 120.00 and 125.00 if all global situation continues under same policies.
Today critical level to watch:
Support: 116.80, 116.00, 115.90, 115.00, 114.20
Resistance: 117.80, 108.00, 118.80, 120.00, 121.48
AUD/USD
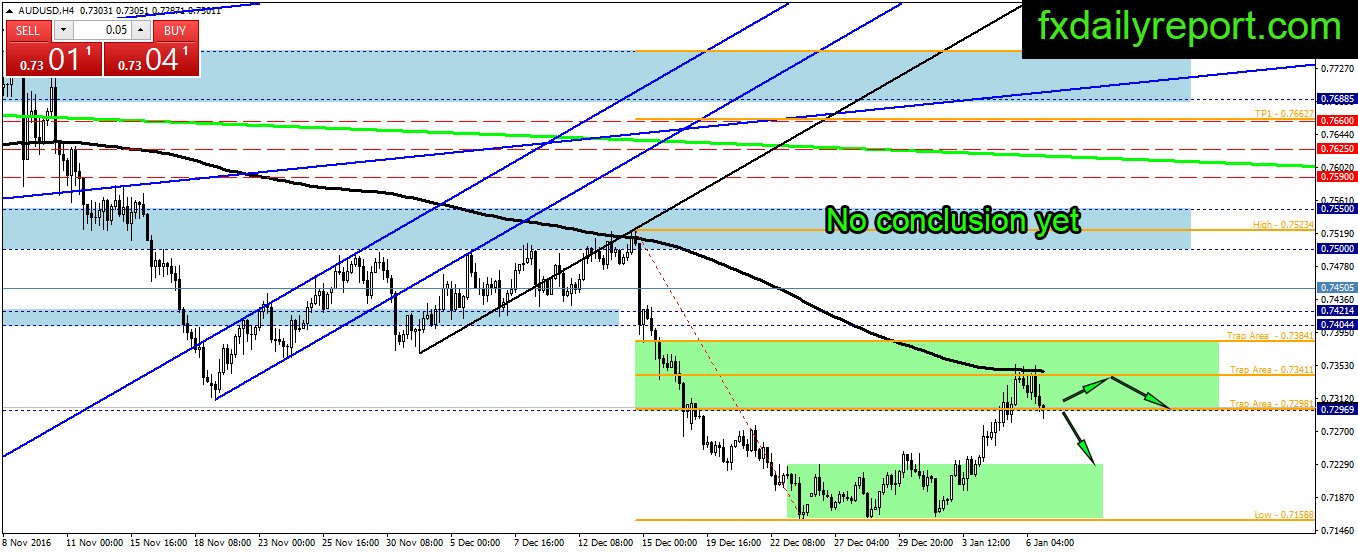
The bear emerges when AUD/USD touch the H4 SMA 200 and also the 50% Fibonacci retracement level. The price fell, but no conclusion yet as it closed inside the green area. The opening of this week, AUD/USD might continue sideway inside the green area. Traders will wait until bearish close below the area or a bullish candlestick pattern formed at the bottom of the green area.
Today critical level to watch:
Support: 0.7300, 0.7286, 0.7239, 0.7225, 0.7195, 0.7160
Resistance: 0.7340, 0.7370, 0.7400