
USDX (USD Index)
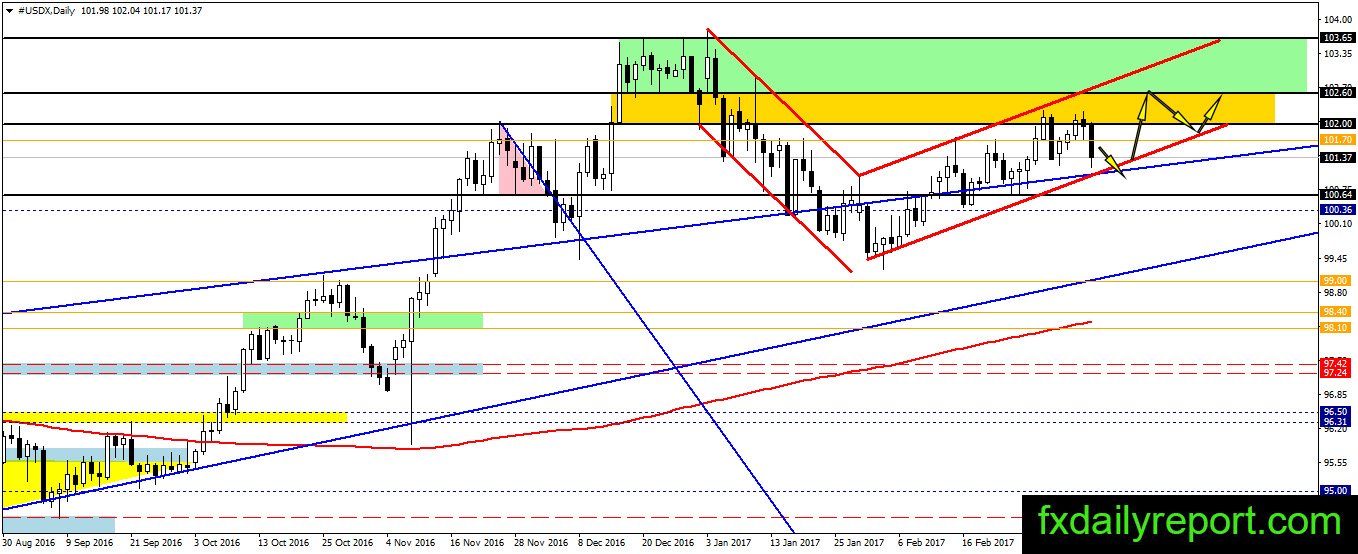
U.S dollar index was testing 102.00 resistance the second time last week. The index looks ready to move higher above 102.00 – 102.60 resistance area. This week, there is a chance the breakout will happen as the Fed hold meeting on the interest rate. On the downside, 101.00 will act as support against further correction.
News to watch

09.30 AM ECB President Draghi Speaks
10.00 PM China Industrial Production, estimated an increase of 6.2% annually.
For full outlook for this week, you can follow Forex Outlook For The Week 6 – 10 March 2017
Technical Analysis
EUR/USD

The breakout of falling wedge pattern put EUR/USD up above 1.0640 resistance. The candle also tested supply at 1.0678 where previous candle high present. Observing the candle, it looks like the upward movement will continue toward 1.710 resistance and possibly to 1.0800 – 1.0825 resistance area.
Today critical level to watch:
Support: 1.0640, 1.0590, 1.0562, 1.0513, 1.0500
Resistance: 1.0710, 1.0800, 1.0825
GBP/USD

Friday candle closed inside Thursday candlestick and formed inside bar pattern. The pattern shows further indecision on GBP/USD near the support. It is possible for the pattern to break either side, traders will observe 1.2200 – 1.2230 for a bounce lower. On the downside, 1.2000 is the target for downward movement.
Today critical level to watch:
Support: 1.2130, 1.2100, 1.2000
Resistance: 1.2200, 1.2213, 1.2230, 1.2300
USD/JPY
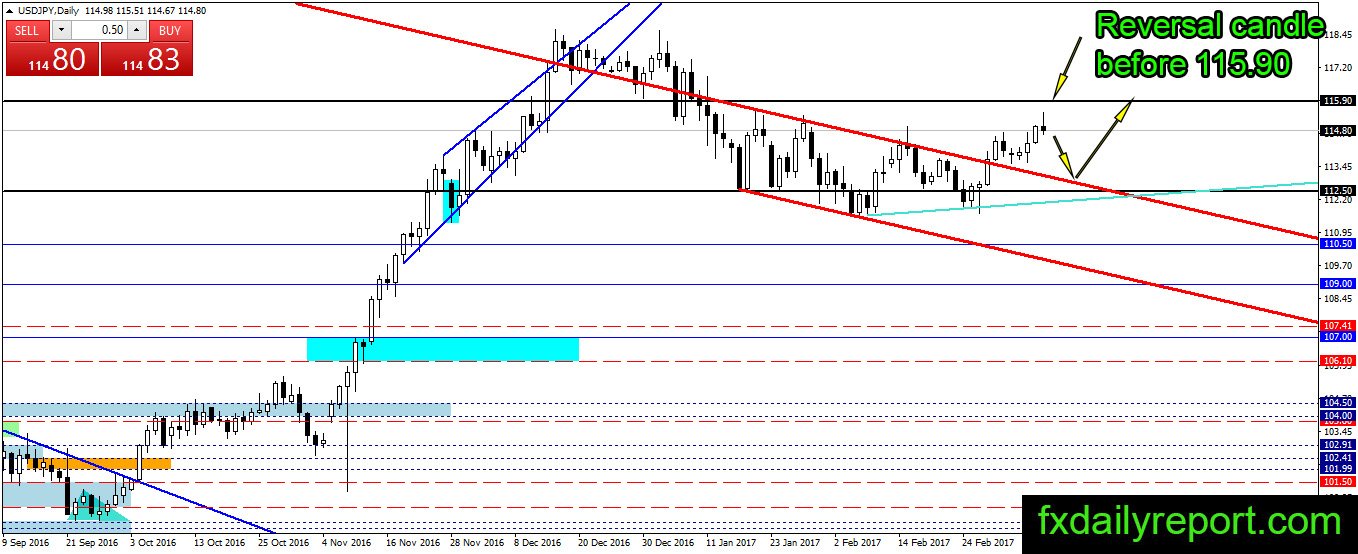
Failure to touch 115.90 put USD/JPY under correction scenario, the candlestick formed bearish pin bar. This week, the market might bring the price down toward 112.50 – 113.00 where horizontal support and channel top present. If no bounce after test of support, we might see the price slide further to 110.50.
Today critical level to watch:
Support: 114.00, 112.87, 112.56, 112.00, 111.62
Resistance: 115.90, 117.52
AUD/USD
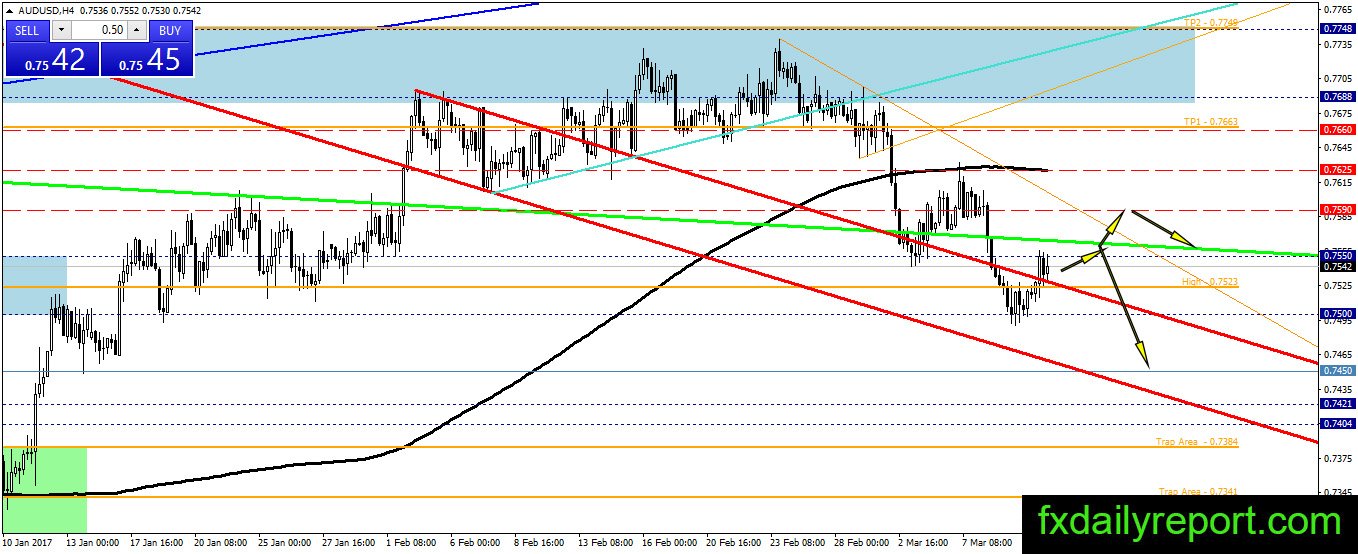
AUD/USD stuck lower with 0.7550 as resistance and the green trend line. The price might move up touch both trendline and horizontal resistance level and resume the downward movement. The bull needs a close above green trendline to reverse the bearish scenario.
Today critical level to watch:
Support: 0.7523, 0.7500
Resistance: 0.7550, 0.7590, 0.7625, 0.7660