
USDX (USD Index)

U.S dollar index fell last week after the indecisive decision taken by the Fed, the price challenged blue trendline but failed to close below it. The bull had upper hand despite bear pressure last week, and we think no certain direction yet as price stay inside yellow triangle range.

The h4 chart shows bearish pin bar when the price attempted to move higher. We might see the price moving lower this week but limited to the blue trendline.
News to watch
4.00 AM German Ifo Business Climate, economist, forecast a change of 0.1 points to 106.3 from 106.2 previous periods.
10.00 AM U.S New Home Sales expected to soften to 598k compared to last month 654k new home sales.
11.05 AM ECB President Draghi scheduled to give speech
For full outlook for this week, you can follow Forex Outlook For The Week September 26-30, 2016
Technical Analysis
EUR/USD
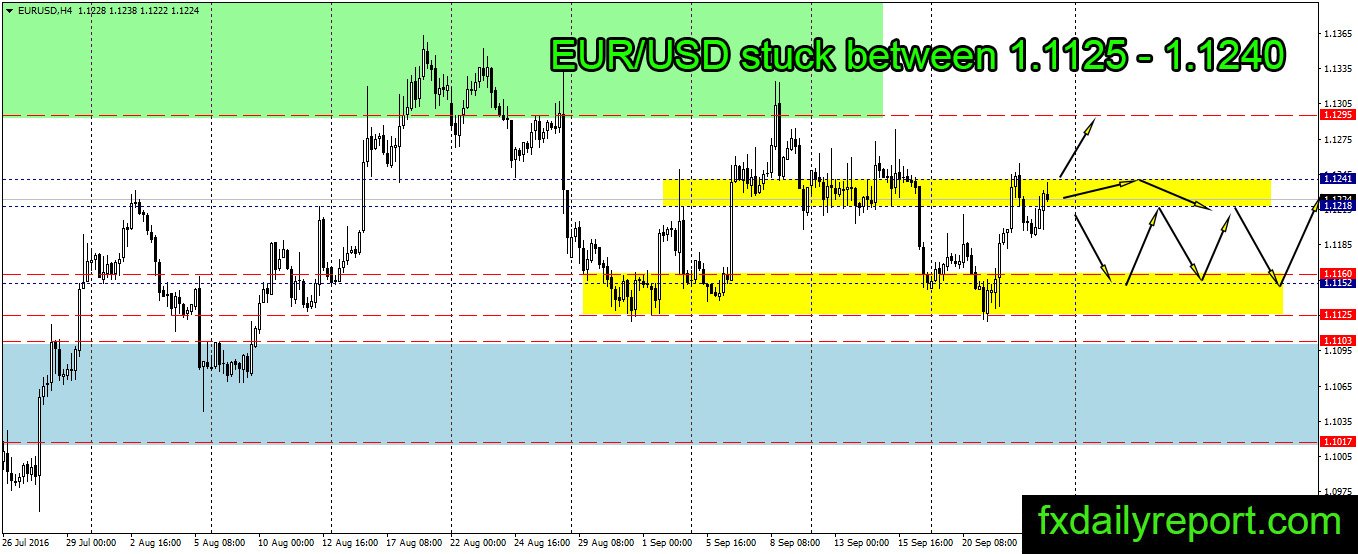
Last week EUR/USD move between 1.1125 – 1.1240, on Daily chart we have three consecutive bullish days. There’s nothing much to expect unless the price break either upside or below the range.
Monday should give us some movement as Draghi will give a speech in the afternoon today.
Today critical level to watch:
Support: 1.1220, 1.1200, 1.1160, 1.1125, 1.1100, 1.1020
Resistance: 1.1240, 1.1300, 1.1320, 1.1400
GBP/USD
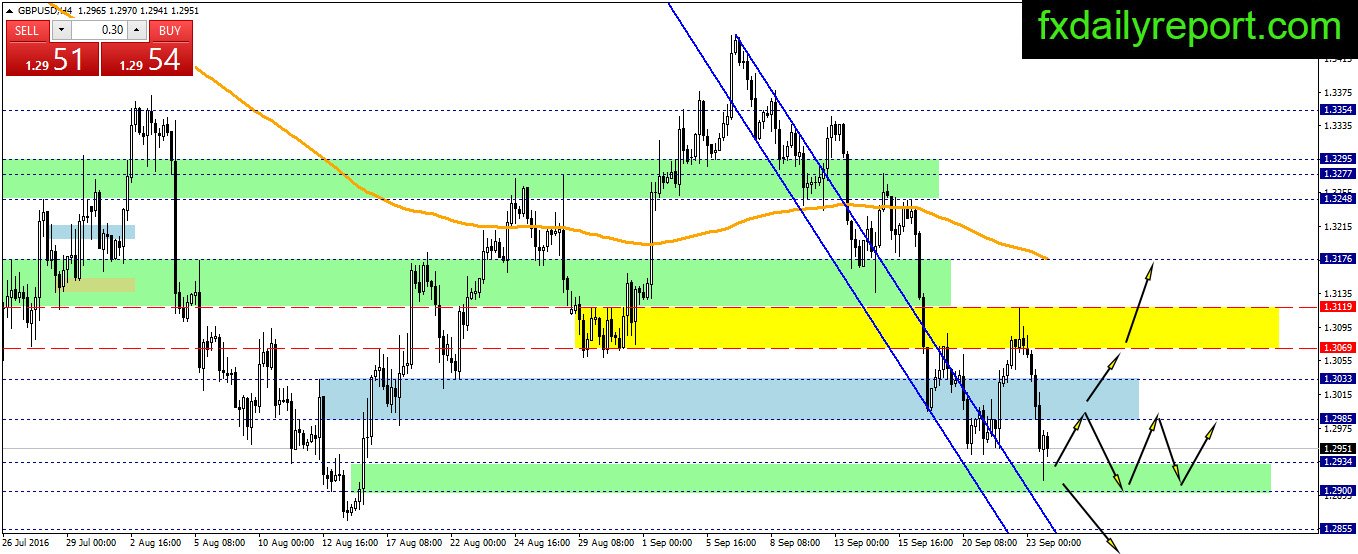
GBP/USD tripped hard last week, giving up the gain after FOMC meeting it move down once again below 1.3000. Observing the price movement, we have 1.2985 – 1.3000 as a resistance area. On the other side, we have 1.2900 and August low 1.2865 as a support level.
The price has more momentum downside which alerts all bull who want to take a shot on a reversal.
Today critical level to watch:
Support: 1.2940, 1.2900, 1.2865
Resistance: 1.2985, 1.3000, 1.3030, 1.3070
USD/JPY

USD/JPY ended the week lower, and it initiated another test toward 100 support. The price currently stay inside 100.50 – 101.50 area, observing the chart pattern we spot bearish flag pattern which will let the price fall further if it triggered.
99.50 – 100 will act as support and a move above 101.50 will help bull to reverse the trend.
Today critical level to watch:
Support: 100.50, 100.00, 99.50
Resistance: 101.50, 102.00, 102.40, 102.90, 103.20
AUD/USD
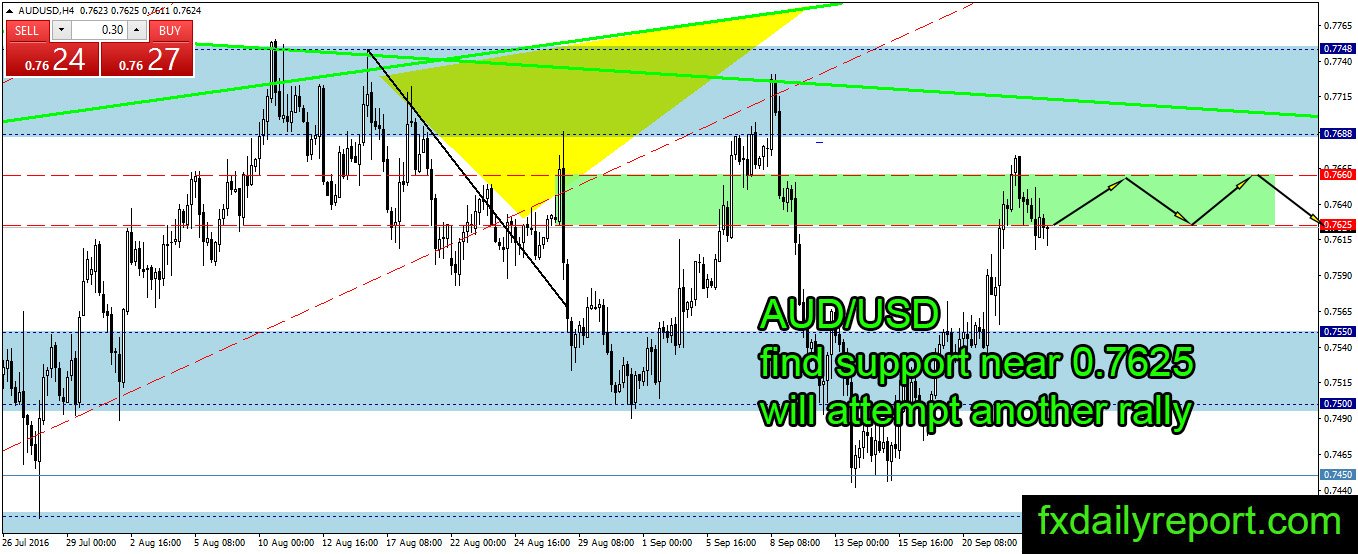
The bear able to reverse the price, but the bull maintain its advantage and close the price near 0.7625. We think it may range between 0.7625 – 0.7660 this week before next trend established. Bias stay bullish but limited to green trendline if it manages to reach that level.
Today critical level to watch:
Support: 0.7625, 0.7550, 0.7500, 0.7450, 0.7420
Resistance: 0.7660, 0.7688, 0.7700, 0.7750