
Gold risk of sell-off
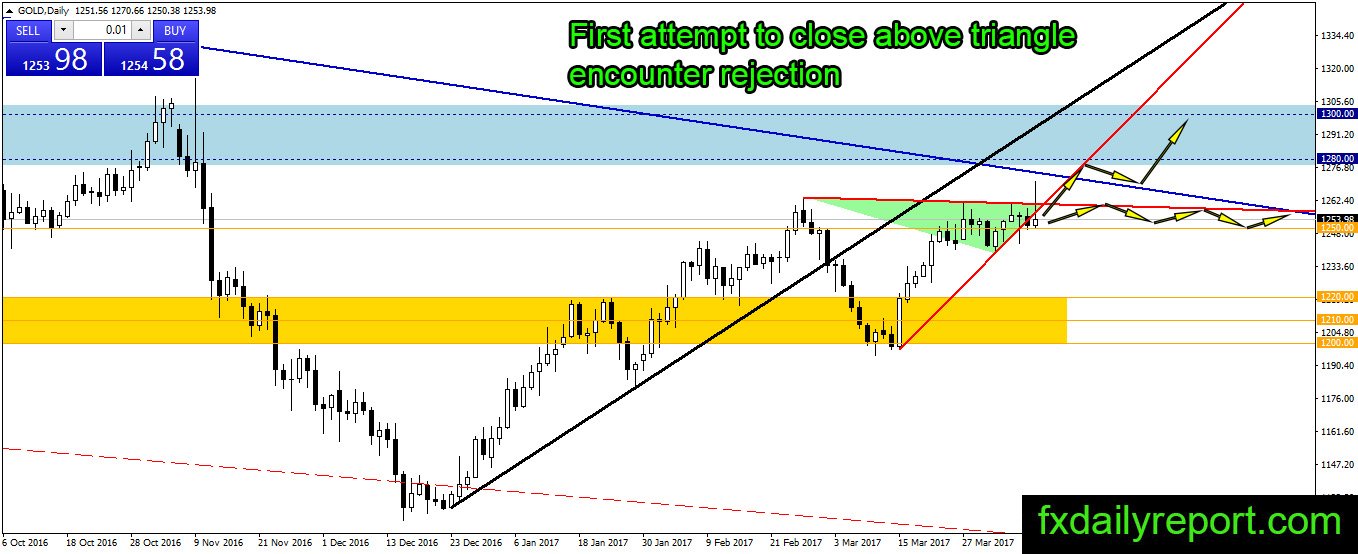
Even though the price of gold advanced for several weeks, the precious metal made a first failure to break the resistance. This failure might be followed by further sell-off this week, but on the other side, traders could look the close inside triangle as the test of water.
There are bear traders who desperate to protect their positions and decide to bring the price down. Their stop-loss level easily spotted at $1,280 – $1,300 area. If the bull could bring the price higher than this level, it will trigger the stop-loss order and put the price sharply higher.

$1,250 expected to hold further sell-off in the gold price this week and the top of the triangle will continue to hinder any attempt higher.
Today critical level to watch:
Support: $1,250, $1,244, $1,237, $1,233, $1,229
Resistance: $1,260, $1,280, $1,300
Silver bearish pattern
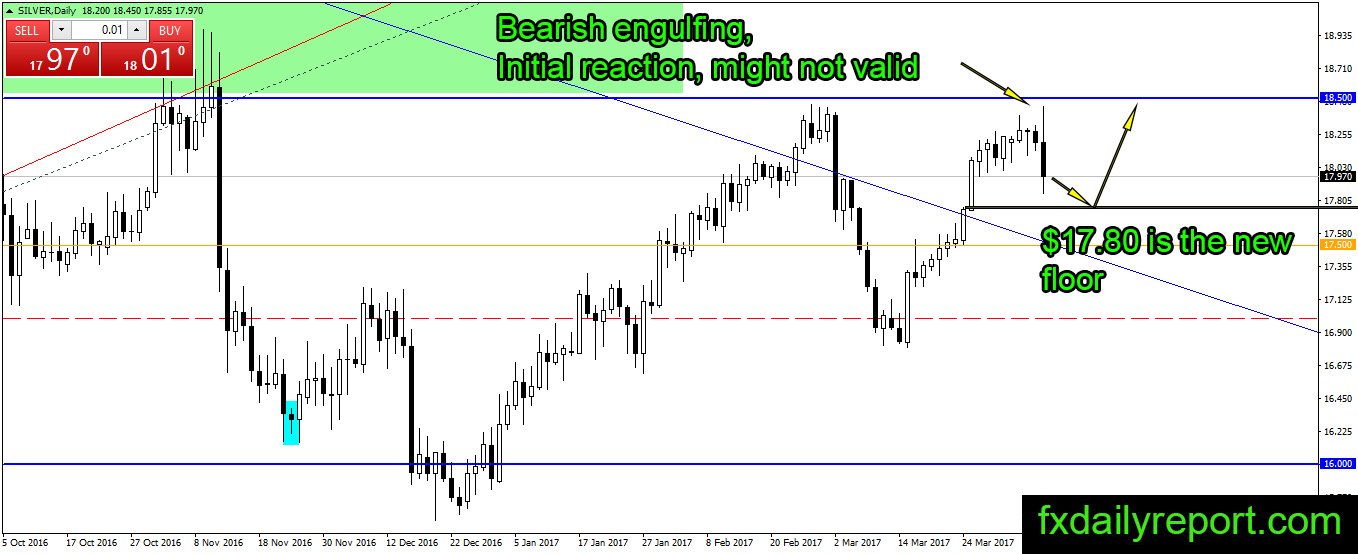
The bearish pattern on the silver daily chart is expected as the price reached $18.50 resistance level. It has not touched $18.50 yet, but it is valid as sell order triggered and irrelevant to the trend. Traders might see this pattern as bearish, but it looks like the bullish pressure has not done yet.
If the price turns down, it will find support at $17.80 where traders could place long position.
Today critical level to watch:
Support: $18.00, $17.80, $17.50, $17.20, $17.00
Resistance: $18.50, $18.95
Crude oil testing resistance
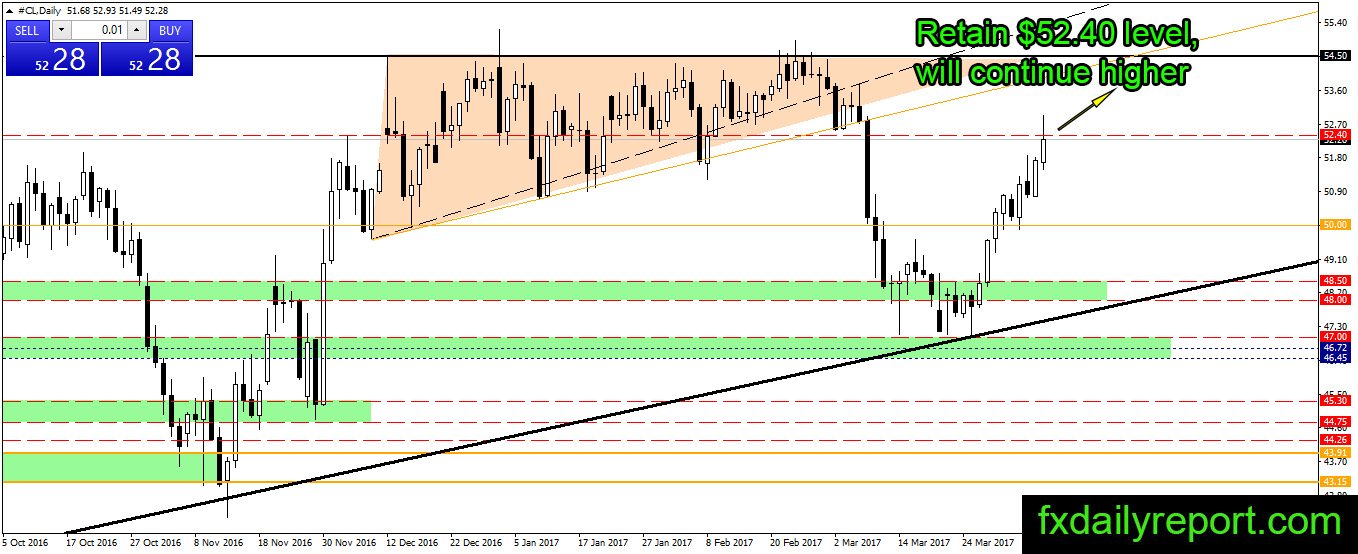
Crude oil successfully retains the $52.40 level previous week and the price close near it. The price thrust upward and might trigger stop order above the massive candlestick in the previous plunge below $52.40 level. Traders could look for the long position after the break above $52.40 and re-test of it.
Today critical level to watch:
Support: $51.50, $50.00, $49.60, $48.50, $48.00
Resistance: $52.40, $54.50