
Gold rejected from multiple highs
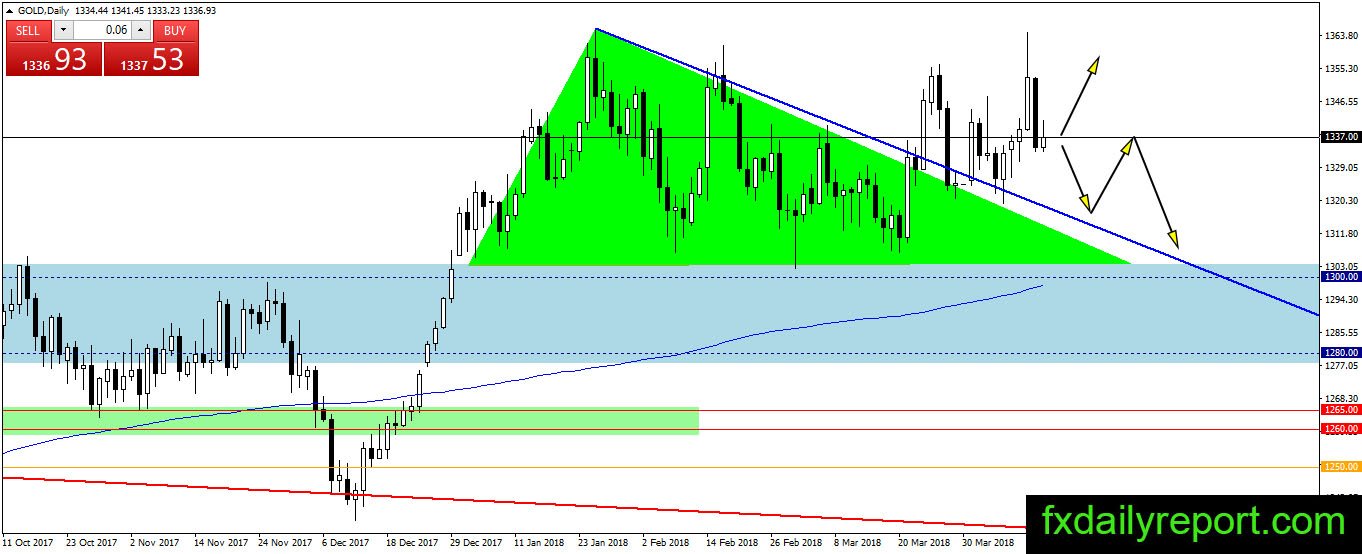
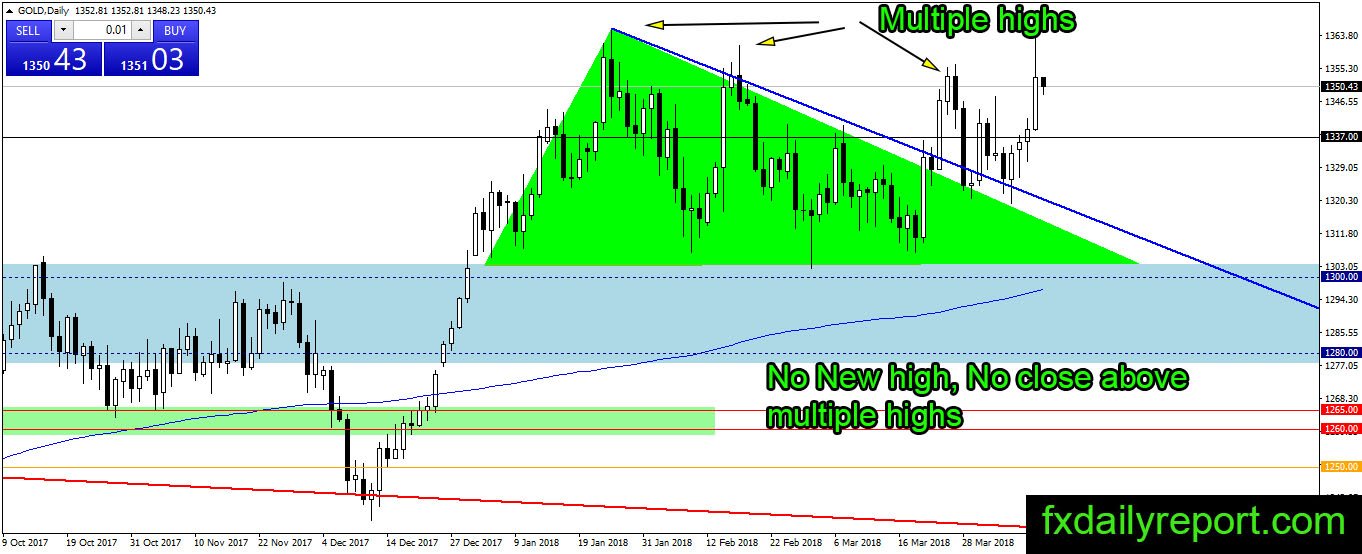
The multiple highs on daily gold chart proved as a strong level to crack for the bull. The precious metal slide in the previous day session where trade tension continues to dampen the mood. News of possible U.S military action against Syria is also throwing fire below the bear.

Gold ease in the previous day as military tension loosen. However, there is probability the sentiment could get sour at any moment, depend on the development of trade between U.S-China and the Syria-U.S situation.
Today critical level to watch:
Support: $1,337, $1,325, $1,320
Resistance: $1,340, $1,350, $1,360
Silver backtrack inside triangle
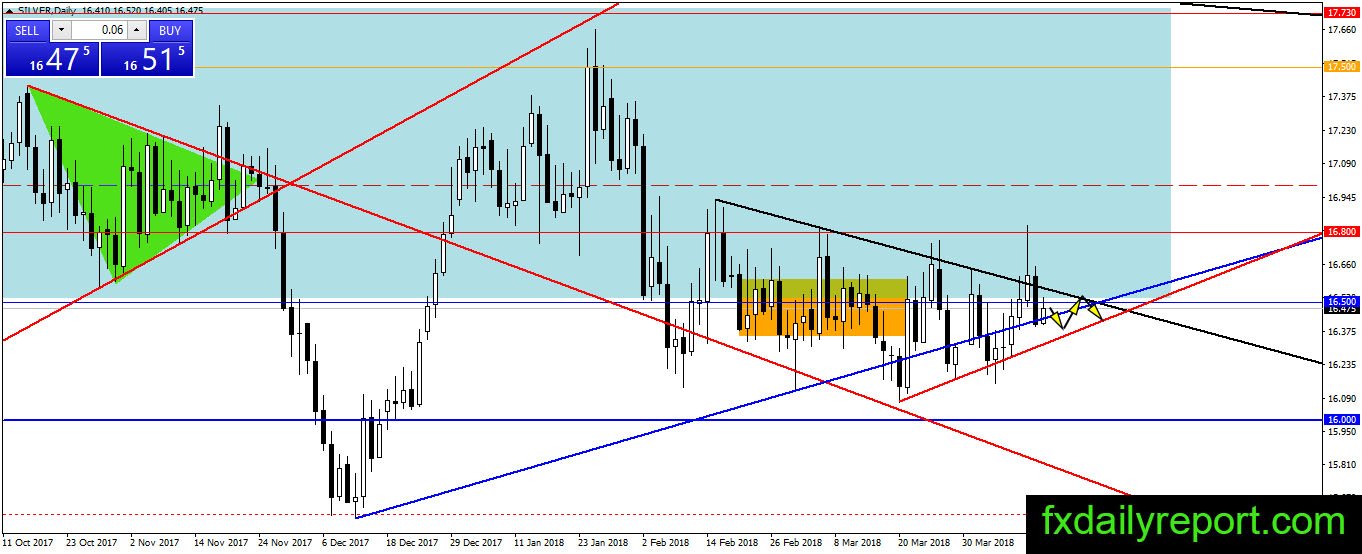
Silver suffer sell-off despite the break above triangle pattern. There is nothing to analyze yet as the pair will follow the sideways trend inside the triangle. We expect the price will settle inside the triangle by the end of the week. Next week, Silver might continue moving inside the triangle and setup for a breakout.
Today critical level to watch:
Support: $16.50, $16.30, $16.00
Resistance: $16.80
Crude oil to close the week bullishly
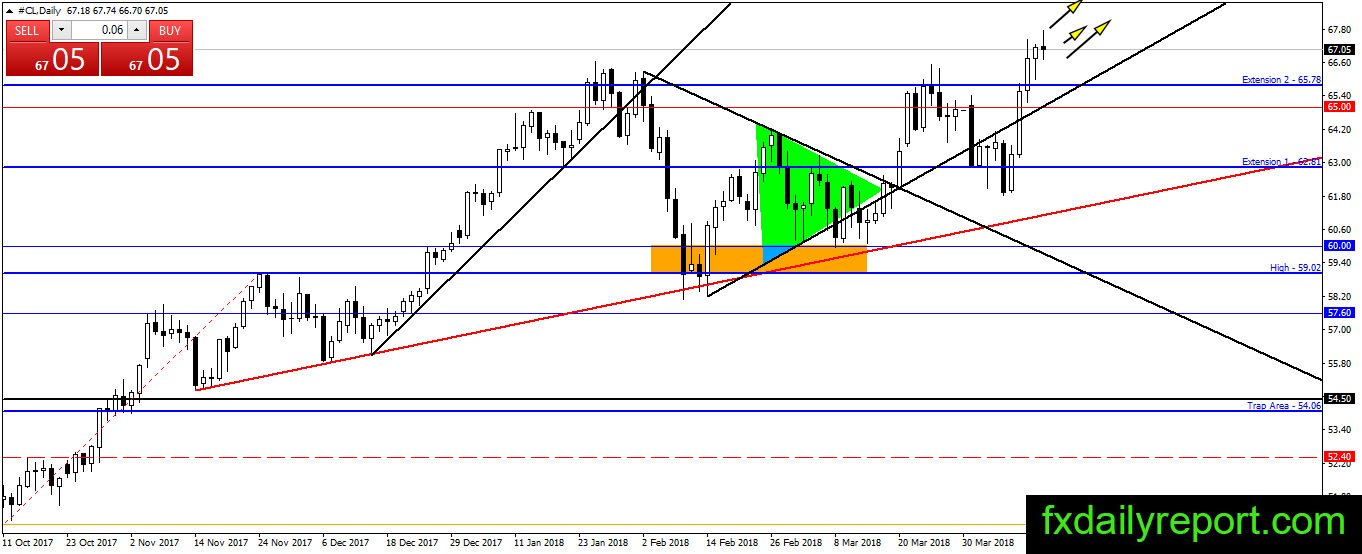
Crude oil hovering at the positive side for the week and cleared $65.78 resistance also 2018 high. The price could continue further upside next week, and traders could look for long position near $65.78 breakout level.
Today critical level to watch:
Support: $65.78, $65.00, $62.80
Resistance: –