
Gold looking for support

It is consolidation day for gold and the sideway movement expected to happen between $1,280 – $1,300. Traders could use this opportunity to take either long and short position inside the range. Even though the sideway trend will start, the sentiment tilted to bullish which mean Traders should look for long position more than short position.
Today critical level to watch:

Support: $1,280, $1,260, $1,250, $1,244
Resistance: $1,300
Silver bearish pattern
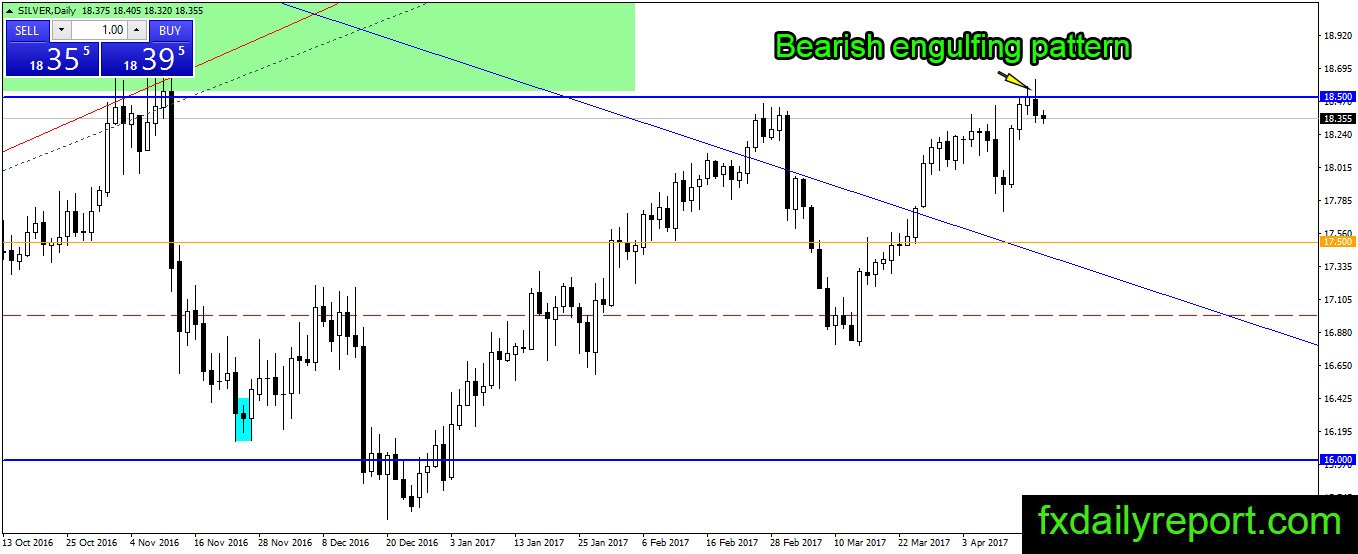
The touch of $18.50 resistance results in a bearish engulfing pattern which is one of the high odds patterns. Despite the bearish candlestick pattern, silver might continue upward from current level as the candlestick might not be confirmed. A bearish trader needs to close the price lower than the pattern low at $18.32. The pattern will be canceled if the price moves higher than the candle high at $18.62.
Today critical level to watch:
Support: $18.32, $18.00, $17.80, $17.50, $17.20, $17.00
Resistance: $18.50, $18.62, $18.95
Crude oil continuation test of broken resistance
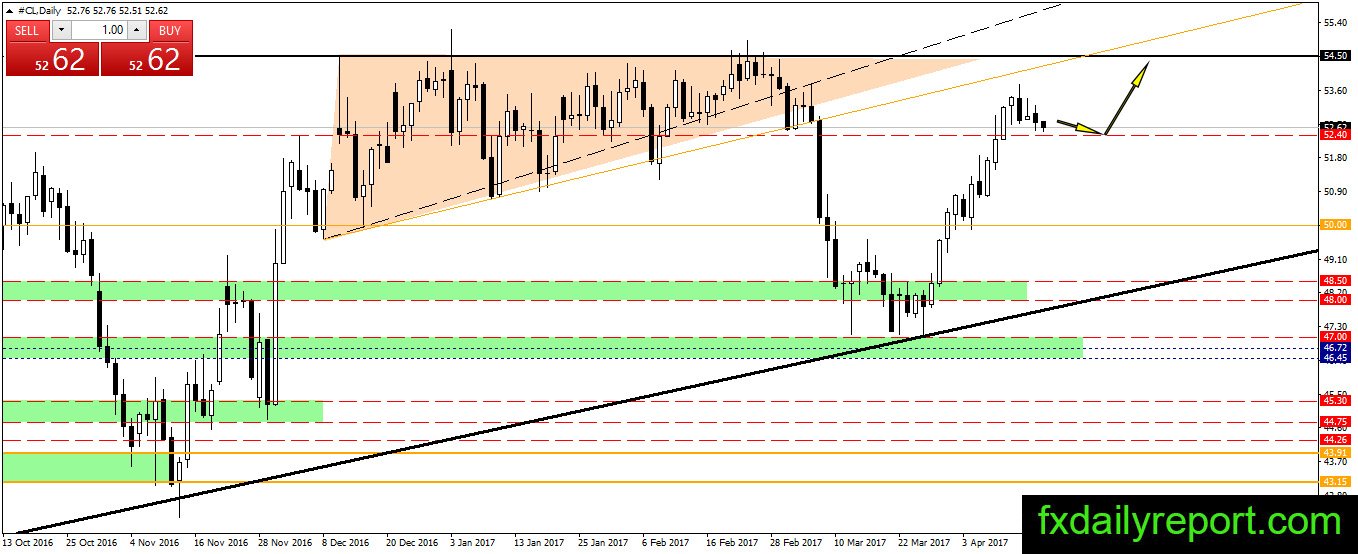
Crude oil prices hovering near the $52.40 broken resistance and looks will continue its consolidation. Traders will continue to observe the price movement near the level and place long position when a bullish pattern formed.
Today critical level to watch:
Support: $52.40, $51.50, $50.00
Resistance: $54.50, $55.00