
Gold bounced from the trendline
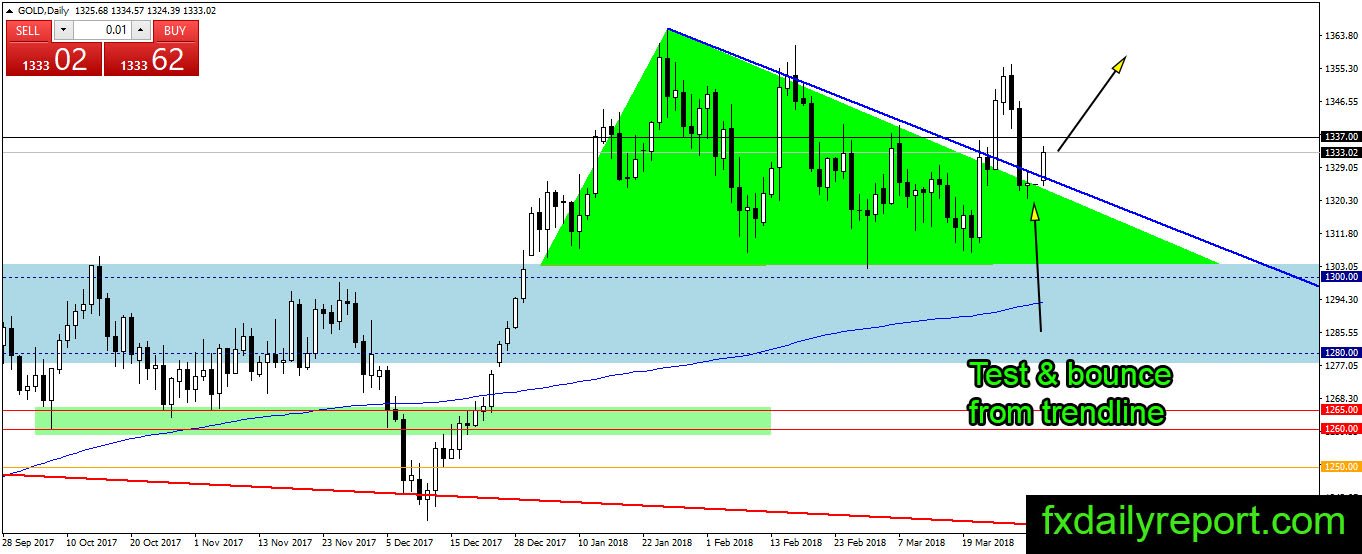
Gold makes a textbook bounce today after the price tested the trendline which is top of the green triangle. The price has moved away from the triangle and targeted a break above $1,337. If the bull could maintain the gold level and close it near $1,337, we might see upward continuation tomorrow.

On the other hand, a rejection near $1,337 followed by strong bearish close might indicate a bearish trend.
Today critical level to watch:
Support: $1,325
Resistance: $1,337, $1,340, $1,350, $1,360
Silver progress inside the triangle
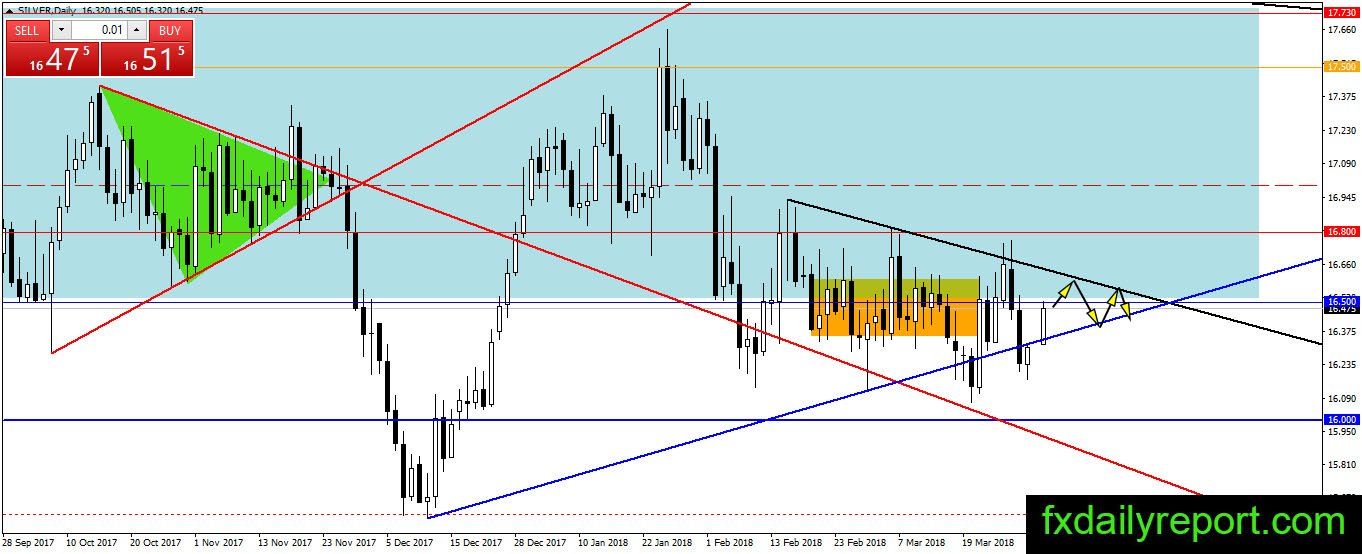
Silver progress inside the triangle range as expected after the bounce from the bottom of the triangle. Without any breakout, we expect the price will continue bouncing inside the triangle range. Traders could place long position at the bottom triangle and short position around $16.50 – top of the triangle.
Today critical level to watch:
Support: $16.30, $16.00
Resistance: $16.50, $16.80
Crude oil no hint for next direction yet
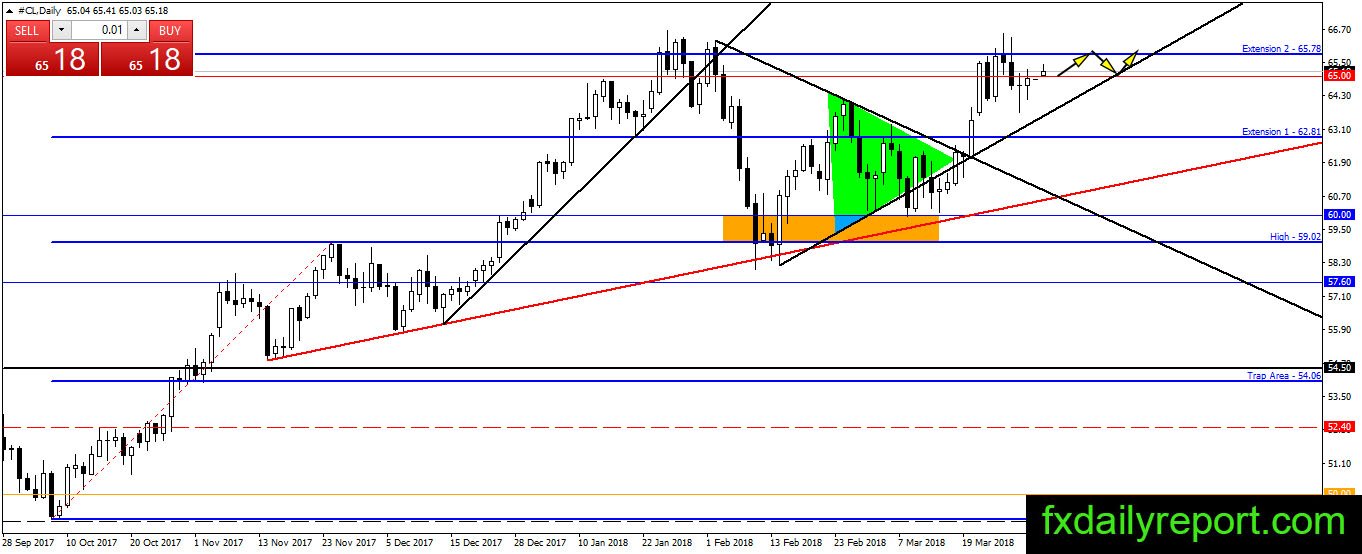
Crude oil traded near its resistance and showing no momentum movement yet. The price might trade inside a tight range while waiting for breakout or rejection from the resistance. Traders might want to stay sideways for now even though short position looks appealing.
Today critical level to watch:
Support: $62.80, $62.50, $60.00, $59.00
Resistance: $65.00, $65.78