
Gold more weakness
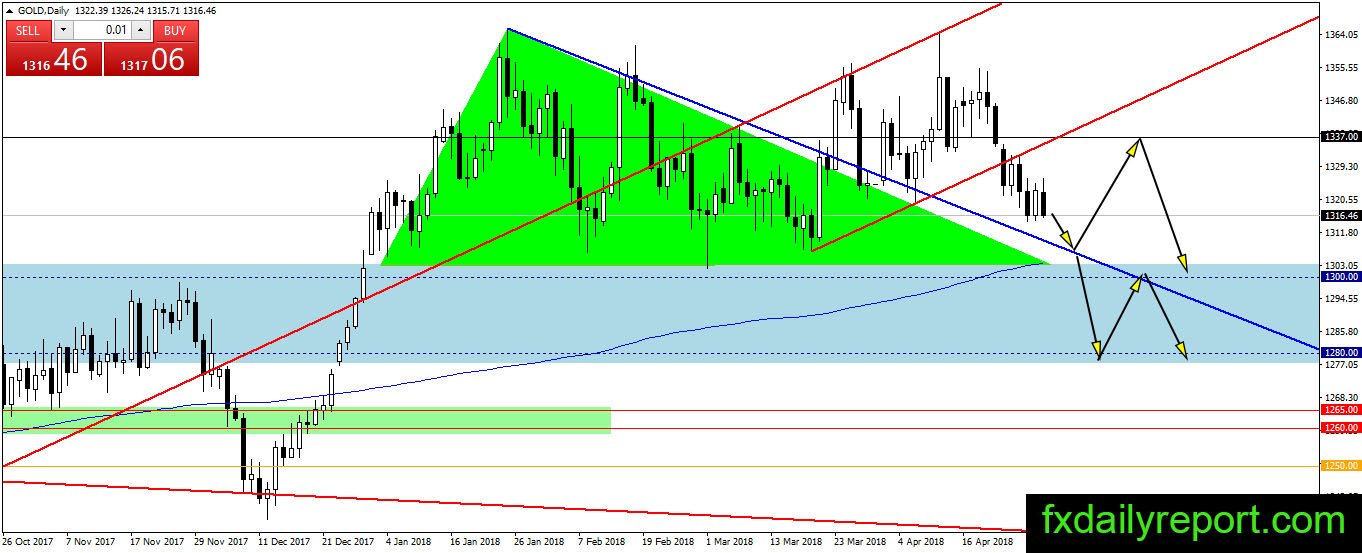
Gold traded lower in the previous week and bounced from the bottom of the broken red channel. The precious metal weakness looks will continue this week with blue trendline as the target of decline. Coincidentally, there is SMA 200 near the blue trendline level and $1,280 – $1,300 support area.

Will the bull continue to maintain gold bullish trend and bounce the price near the confluence of supports? Alternatively, will we see a new bearish leg below $1,300?
Today critical level to watch:
Support: $1,300
Resistance: $1,320, $1,325, $1,337, $1,340
Silver crack in support
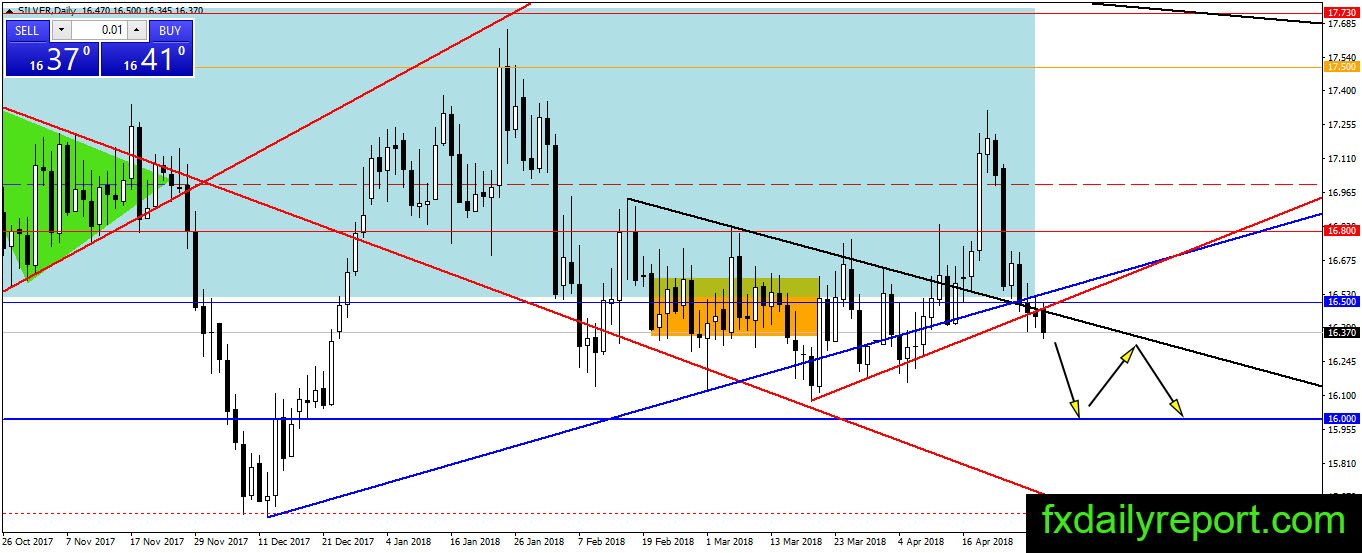
Silver support cracked by the bear today as the price move below the red trendline. The situation is dangerous for the bull and could lead to a continuation of the bearish leg toward $16.00. Traders might want to avoid long position under current situation and prepare for short near $16.50 or when retest of trendline happen.
Today critical level to watch:
Support: $16.00
Resistance: $16.50, $16.80, $17.00, $17.50
Crude oil prepare to grasp $70.00?
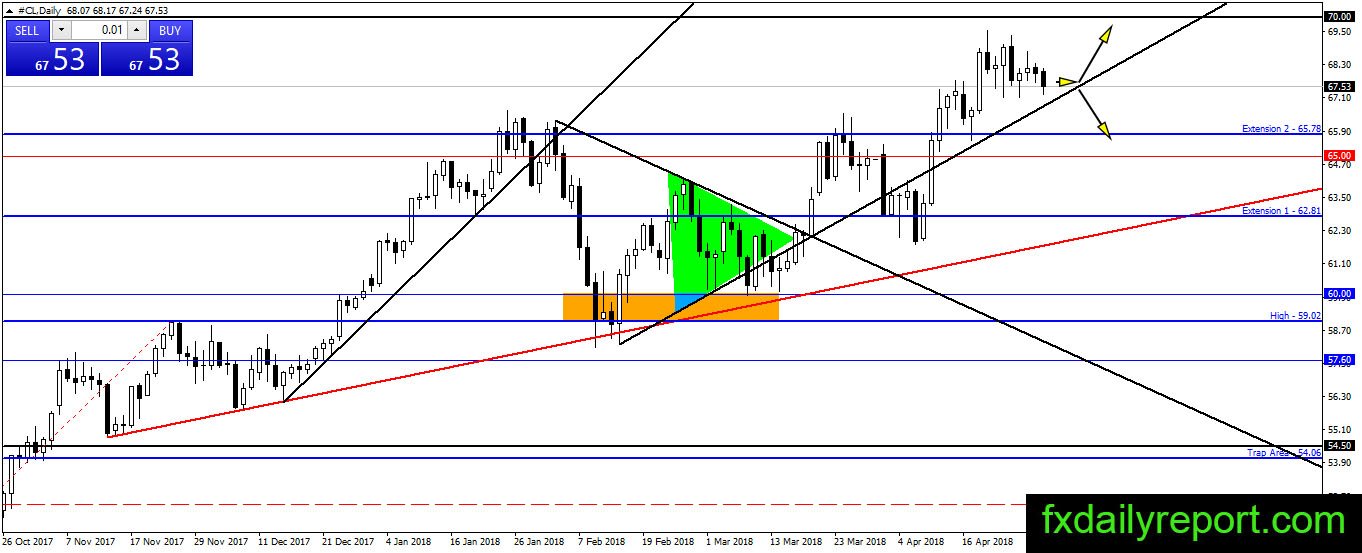
Crude oil move in sideways trend and no new direction settle yet. We will wait until the price hit trendline and show a reaction. It is possible the bull is building the floor and aiming for $70.00 in price. Meanwhile, it is better to trade another instrument.
Today critical level to watch:
Support: $65.78, $65.00, $62.80
Resistance: $70.00