
Gold tested $1,280, waiting for the next direction
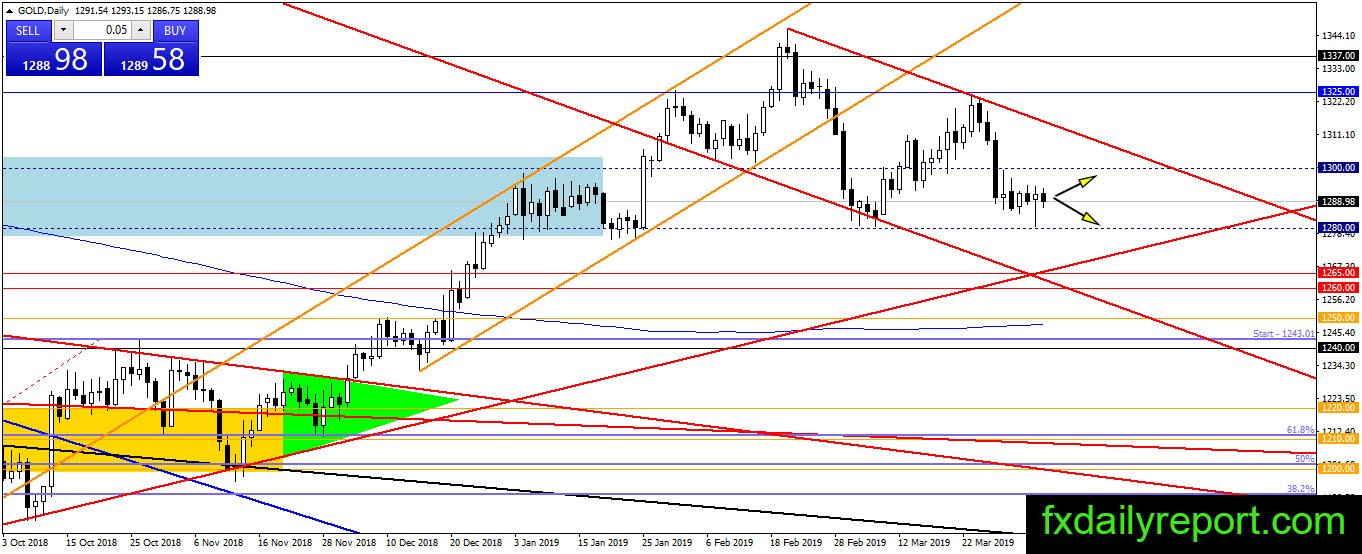
In the previous day, gold continues its sideways movement but suddenly fell toward $1,280 with strong momentum. The downward movement tested the level near $1,280 and bounce back immediately and close the day above its opening level. It is an initial bullish sign and might continue today.

Traders and investors are waiting for U.S job data which could spark volatility. Gold next direction might be determined by the close of the weekly candlestick.
Today critical levels to watch:
Support: $1,280
Resistance: $1,300, $1,320, $1,325
Silver stay inside $15.00 – $15.20
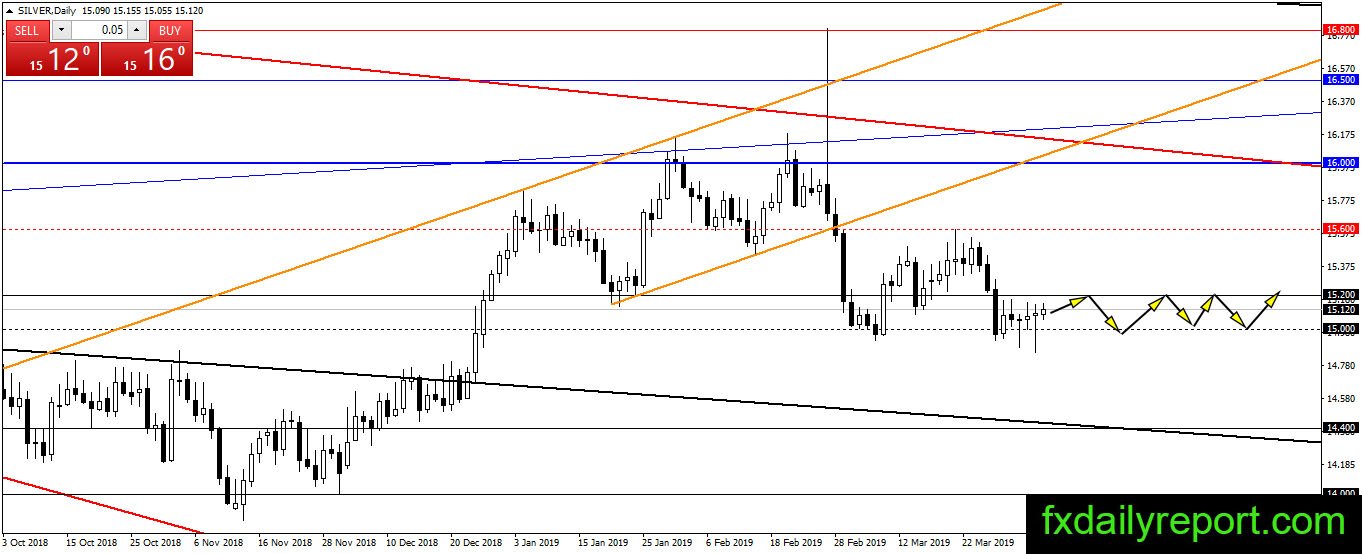
Silver drop below $15.00 in the previous day but manage to recover back its opening level. There is no change to the trend yet which is sideways between $15.00 – $15.20. Traders might want to wait for the release of U.S job data to determine the next direction of silver today.
Today Critical levels to watch:
Support: $15.00, $14.40
Resistance: $15.20, $15.60, $16.00
Crude oil hanging near trendline
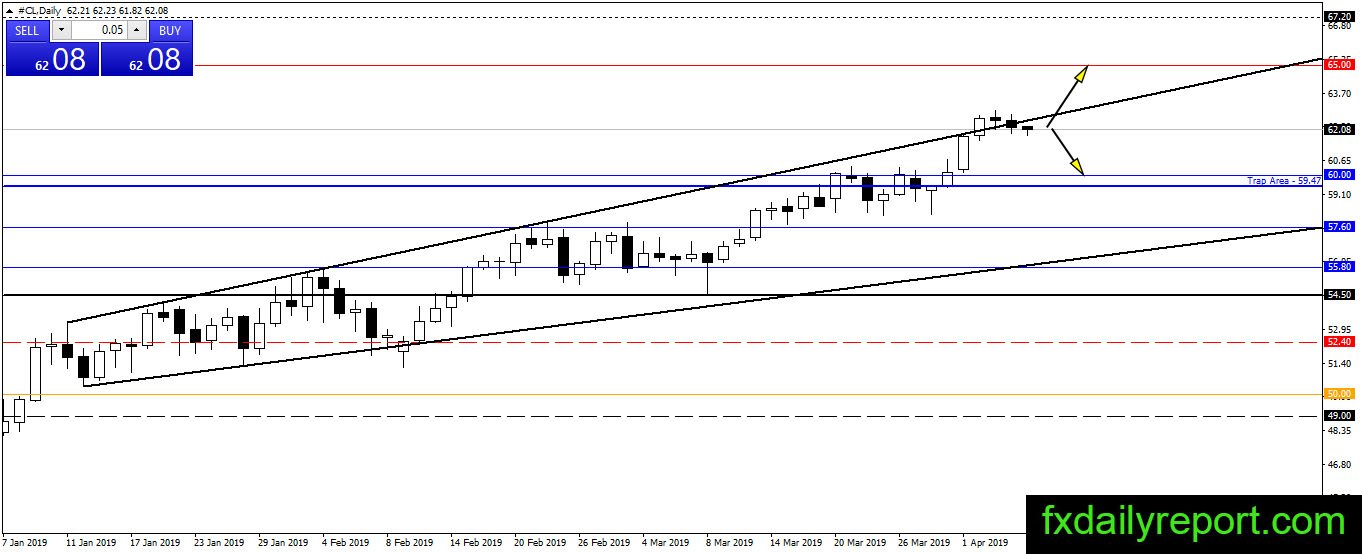
Crude oil trend is bullish with $65.00 as the target. At the current time, the price hanging near trendline on the daily chart and showing no momentum. The only long position traders could consider is when the price moving lower to test $60.00. On the upside, $65.00 is the level to look for short positions.
Today critical level to watch:
Support: $60.00, $57.60, $55.80
Resistance: $65.00