
Gold another bounce from the triangle
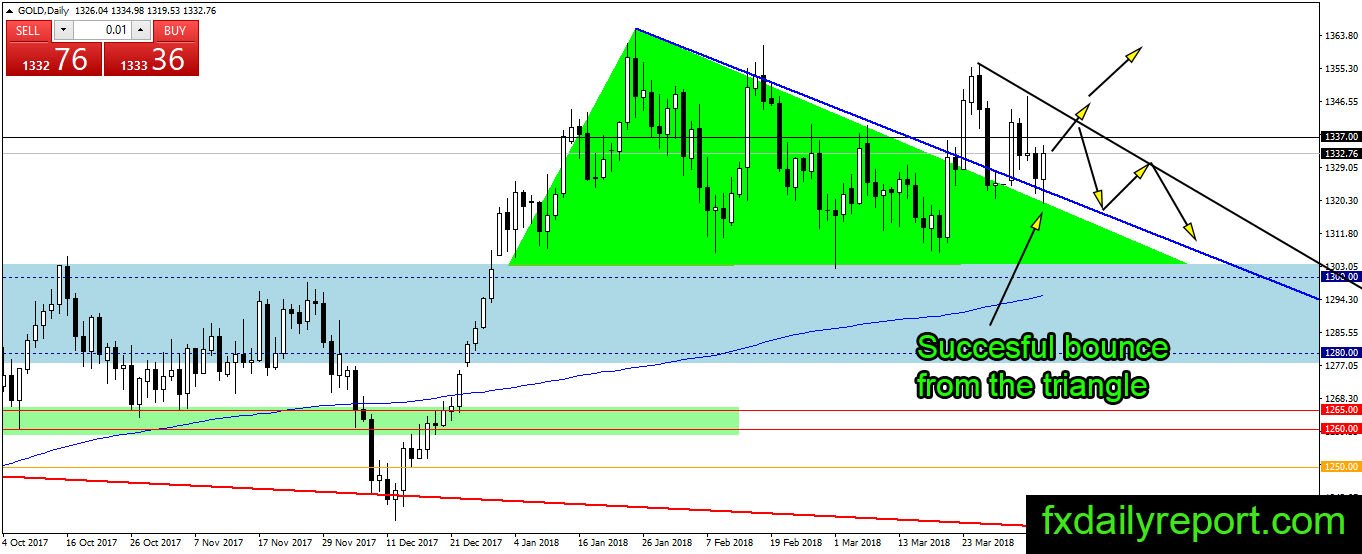
Gold downward movement stopped today, and the precious metal uses top of the triangle as a support level for a bounce. Currently, the bounce almost reached $1,337. We might see further upward movement before the market close this week which could put gold near $1,337.

Next week, traders might watch the test of $1,337 and the downtrend line shown on the daily chart.
Today critical level to watch:
Support: $1,325, $1,320
Resistance: $1,337, $1,340, $1,350, $1,360
Silver more triangle bounce
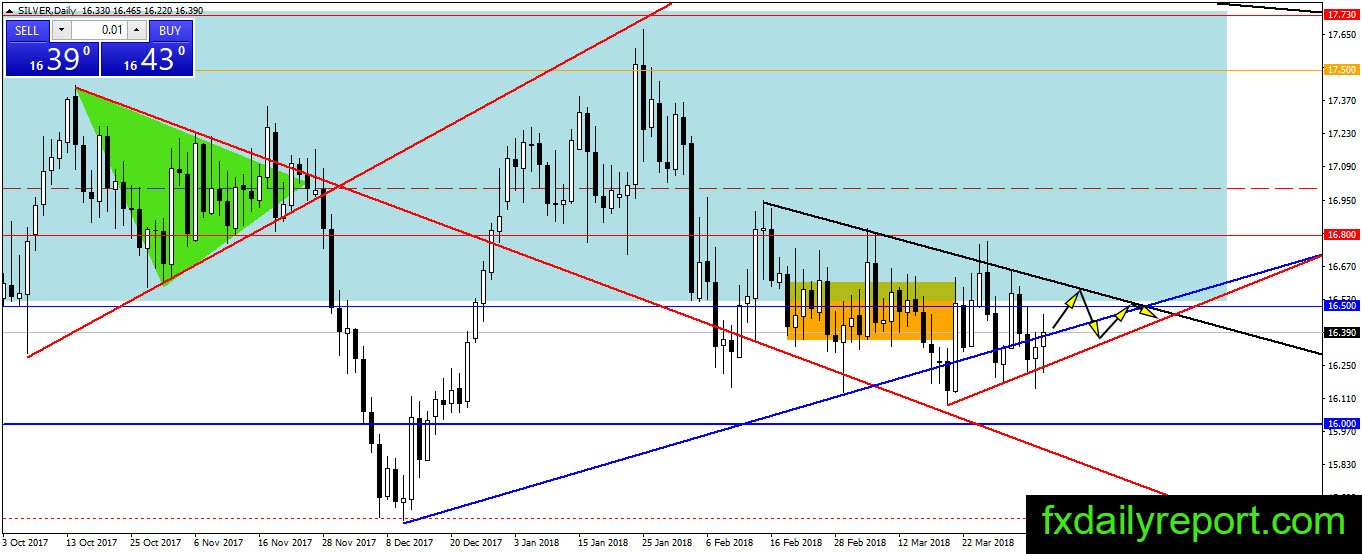
Silver bounced from the bottom of the triangle and not out of expectation yet. The precious metal should continue moving inside the triangle range next week. There is no change to the strategy, and traders could use the range to take both long and short position.
Today critical level to watch:
Support: $16.30, $16.00
Resistance: $16.50, $16.80
Crude oil more bearish pressure
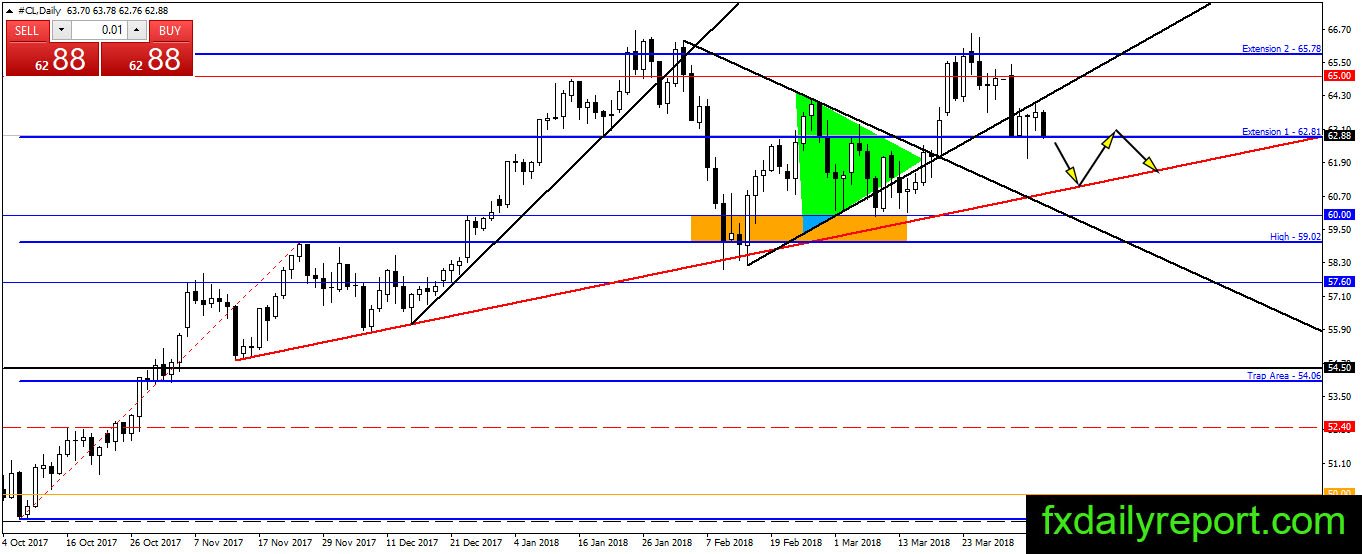
Crude oil is unable to maintain the bullish sentiment after the higher deficit report on U.S inventory this week. The commodities currently fall and testing $62.80 again. Will the support level broken and open the way for bear toward the red trendline?
Today critical level to watch:
Support: $62.80, $62.50, $60.00, $59.00
Resistance: $65.00, $65.78