
Gold looking for a bullish breakout
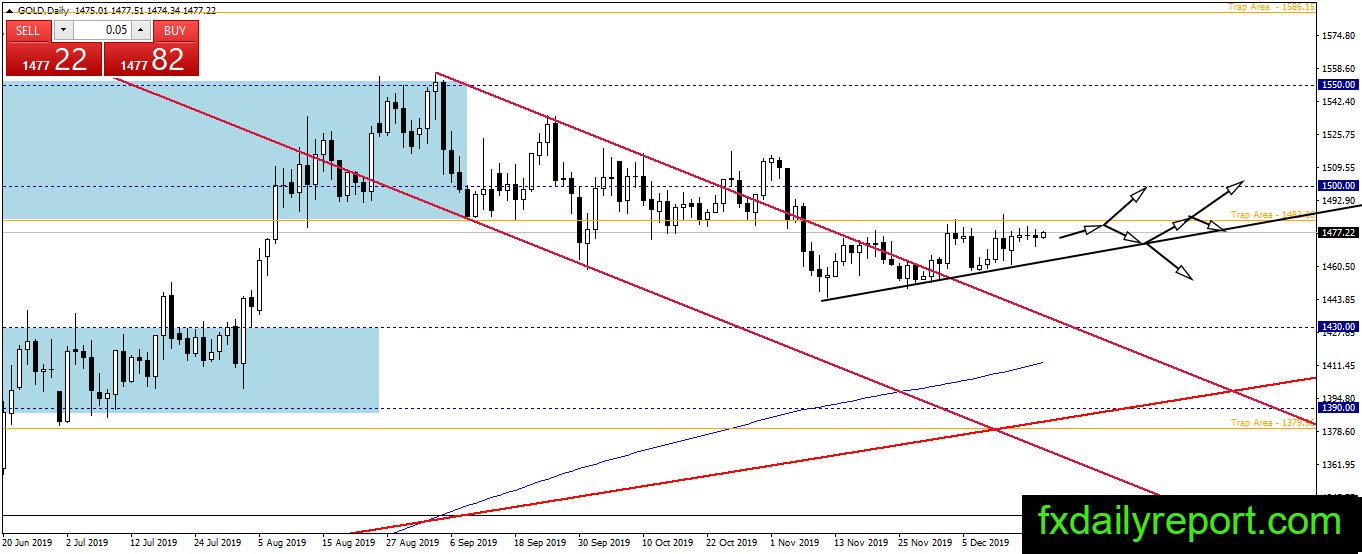
We have a possible bullish ascending triangle formation in the gold daily chart. The price of gold might continue its uptrend and breakout above $1,480 resistance. Traders will observe the ascending triangle pattern and look to add more long positions when the price makes a bearish correction.

However, if the price makes bearish breakout below the pattern then gold might continue lower to reach $1,430
Today critical levels to watch:
Support: $1,450, $1,430
Resistance: $1,480, $1,500, $1,550
Silver more bullish pressure
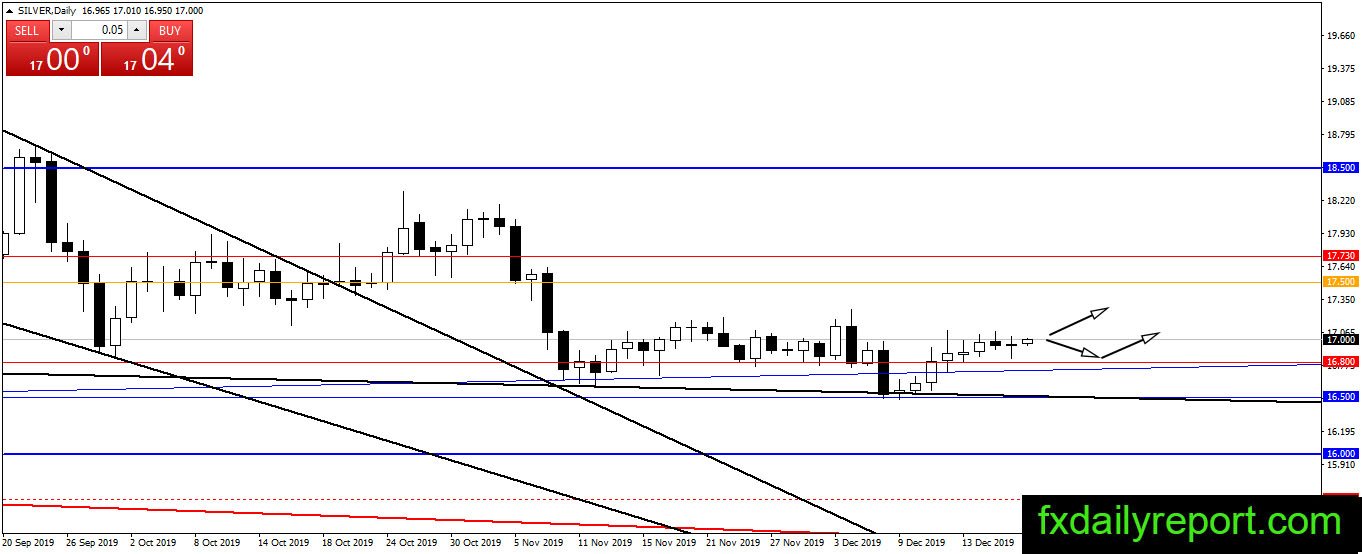
The price of silver moving upward and currently testing $17.00 resistance. No major reaction from the resistance level at the current time. If the price could not break out higher with significant momentum then silver expected to consolidate between $16.80 – $17.00.
Today Critical levels to watch:
Support: $16.80, $16.50
Resistance: $17.00, $17.50, $17.73
Crude oil more bullish close
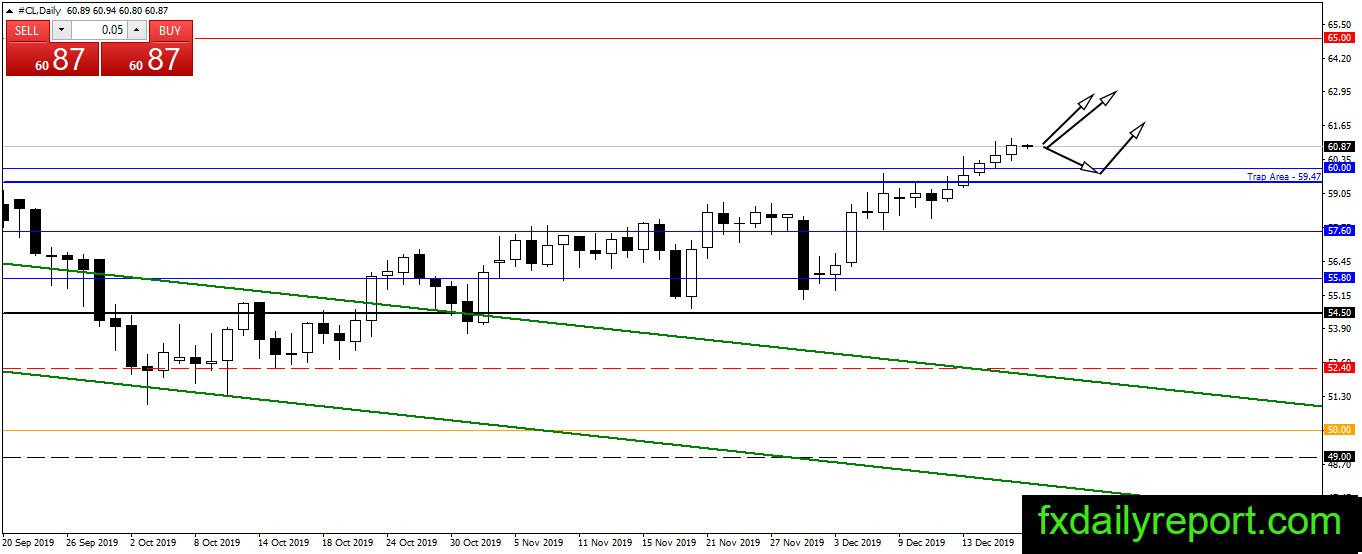
Another bullish close happens in crude oil prices. It closed higher for the fifth day and might extend its gain today. Similar to the previous day analysis, traders will expect the price to continue upward supported by OPEC’s decision to further lower production level.
Today critical level to watch:
Support: $60.00, $59.50
Resistance: $65.00