
Gold higher inside triangle

The market on Friday started an upward movement in the gold price. It bounces near the blue trendline and continues toward the bearish trendline shown in the H1 chart. In higher time frame chart, the price looks to consolidate and not much movement expected. The range of gold span from $1,127 – $1,133, scalper or short-term trader can use the range as a reference to trade.
A long-term trader should wait for a break outside of the consolidation range.

Today critical level to watch:
Support: $1,127, $1,122, $1,100
Resistance: $1,133, $1,144, $1,150, $1,160, $1,166
Silver attempted lower
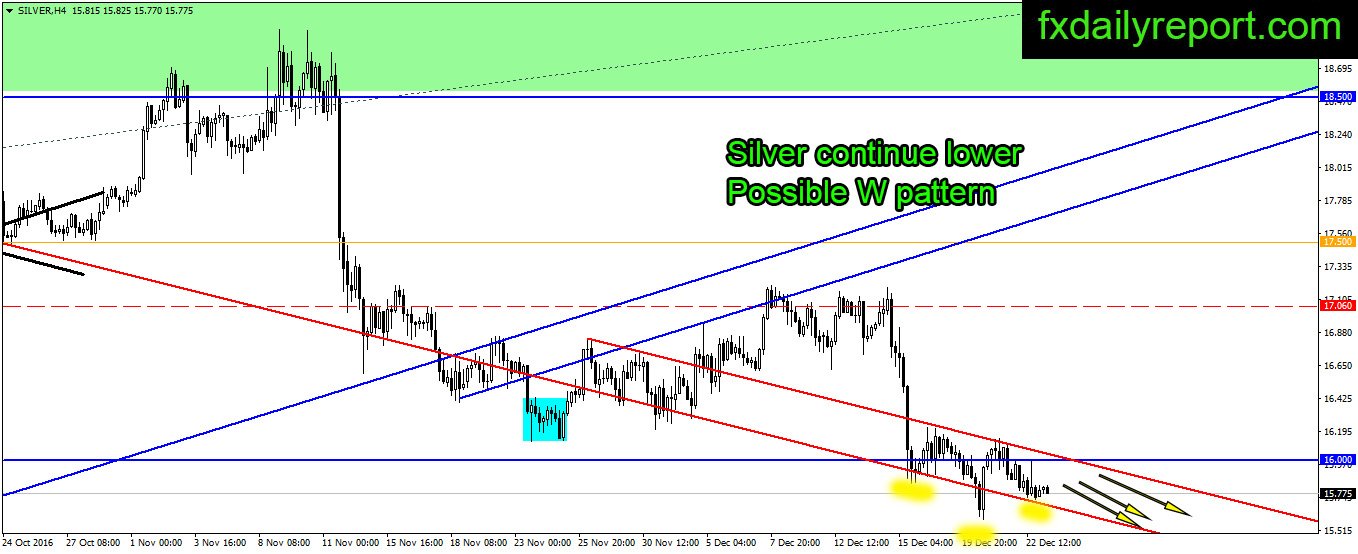
Silver continue lower inside the bearish channel, there is possible W pattern under formation on the H4 chart. If the W pattern formed, the bull needs to bring the price close above the bearish red channel and $16.15 to confirm the pattern.
Today critical level to watch:
Support: $15.80, $15.50
Resistance: $16.00, $16.15, $16.40, $16.50, $16.75
Crude Oil
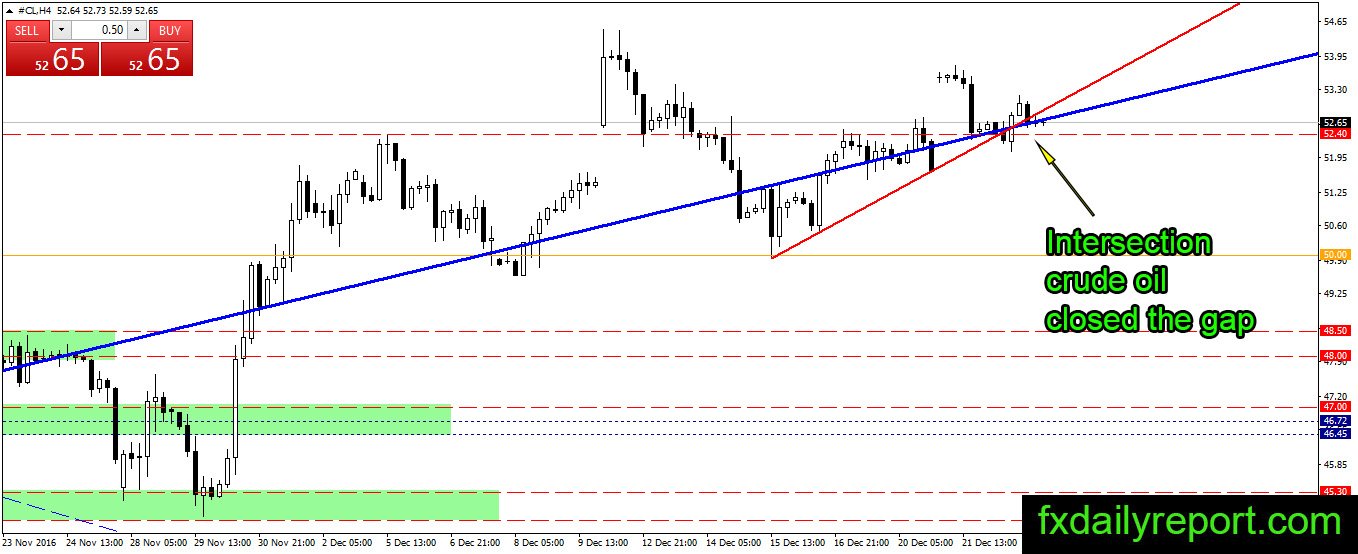
The crude oil price closed the gap after it opened higher above the $52.40, there is no indication where price will head next. Wednesday EIA crude oil inventory reported an increase of 2.3 million barrels.
Today critical level to watch:
Support: $52.40, $51.93, $50.50, $50.00, $49.60
Resistance: $54.50, $55.00