
Gold slightly lower before $1,250

Continuation of bullish movement in gold is expected, but the price might need to move lower and test support level before any advance. The tax policy in America might give impact on gold price as optimism building in the capital market. People say when the capital market in risk-taking mode, then it might put safe-haven asset such as gold down.
Today critical level to watch:

Support: $1,220, $1,200, $1,184, $1,180, $1,166
Resistance: $1,250, $1,280 – $1,300
Silver charging without stop
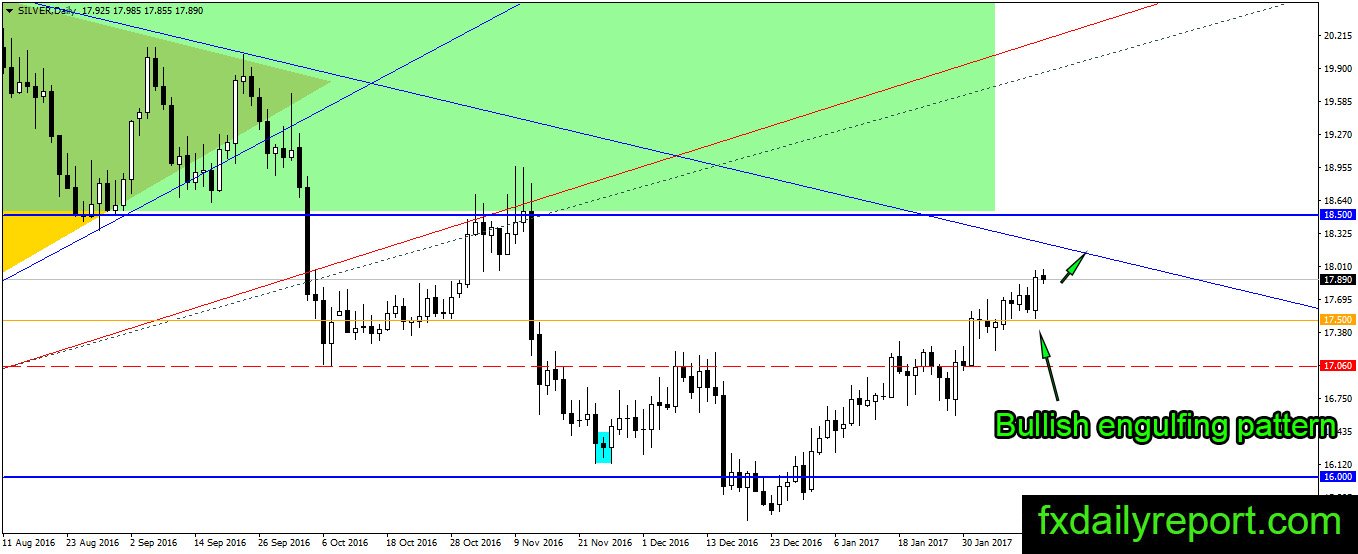
Bullish engulfing pattern closed the weekly trading session and put silver closer toward its bearish trendline. The pattern does not have much room upside which might put traders under cautious approach. If it breaks above the bullish candlestick pattern, it might meet with quick sell-off from the trendline.
Today critical level to watch:
Support: $17.50, $17.20, $17.00, $16.75, $16.50
Resistance: $18.00, $18.50
Crude oil three consecutives bullish candle close
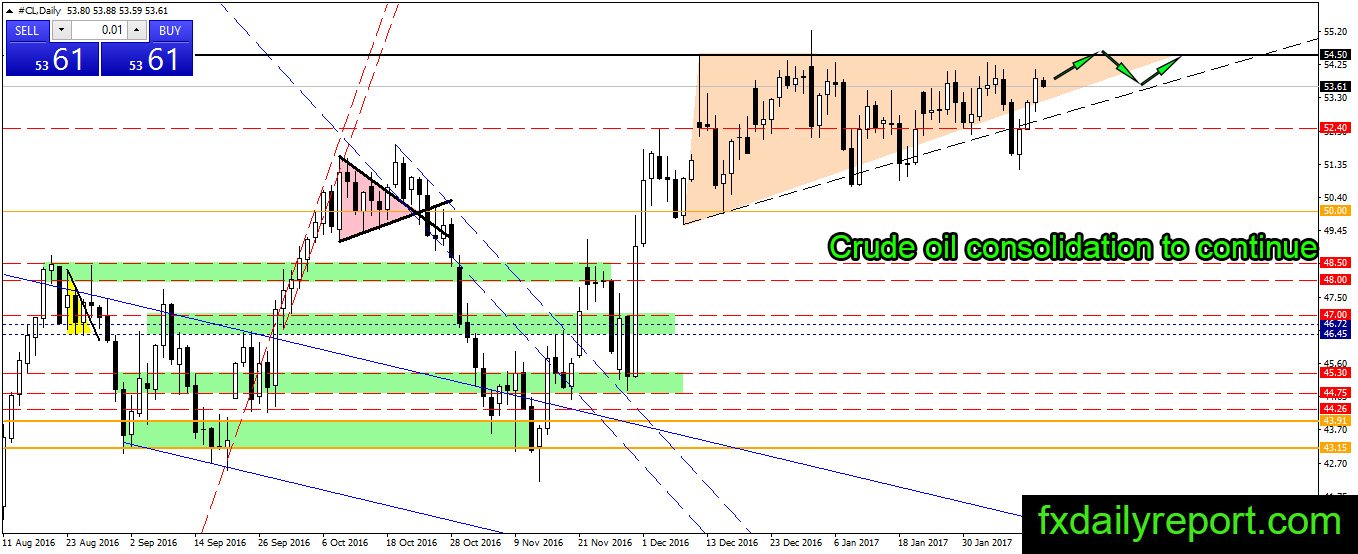
Three bullish candle closes overturn the recent bearish trend below triangle pattern. Crude oil on the path higher and the break above triangle will happen soon. Traders might want to place long position near the bottom of triangle while placing tight stop losses below $50 – $51.20
Today critical level to watch:
Support: $52.40, $51.93, $50.50, $50.00, $49.60
Resistance: $54.50, $55.00